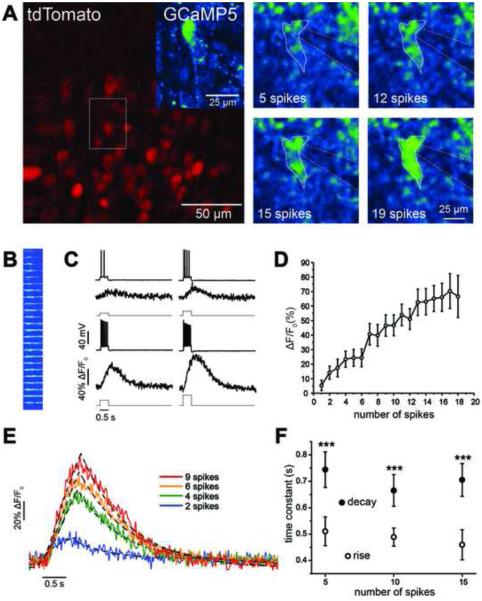
Figure 4. Quantification of Spike-Evoked GCaMP5G Fluorescence Signals in CA1 Pyramidal Cells.
(A) A patched CA1 pyramidal cell expressing tdTomato and GCaMP5G (inset) in a CaMKIIα-Cre; PC::G5-tdT. The panels on the right demonstrate GCaMP5G fluorescence intensity changes in a single CA1 pyramidal cell during current-evoked spiking acquired using a full raster scan. (B) Line scan image of GCaMP5G fluorescence resulting from increasing levels of current-evoked depolarization. (C) Representative time series of membrane voltage and ΔF/F0 responses to current-evoked signals for 4 different current step sizes and spike count numbers. (D) Plot of ΔF/F0 showing mean CA1 pyramidal cell population responses. (E) Kinetics of GCaMP5G fluorescence signals. The rise and decay time course of individual ΔF/F0 signals elicited by different spike counts (colored lines) were fitted with exponential functions (dashed lines). (F) Mean time constants associated with rise times were significantly shorter than those of decay times across a range of stimulus intensities and spike counts. Data are means ± SEM. ***p<0.001 between rise and decay time constants. All experiments were performed on 4-8 week-old mice. See also Figures S5, S6, S7 and Movie S2.

