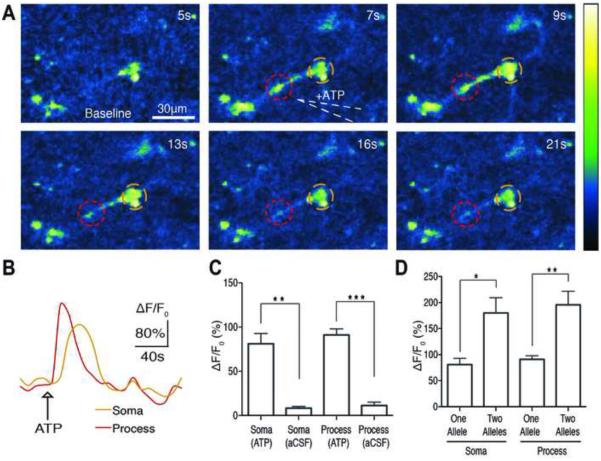
Figure 7. PC::G5-tdT is a Sensitive Indicator of Calcium Transients in Microglia.
(A) Time series of intracellular calcium increases induced by focal application of ATP (100 μM) from a glass pipette (white dotted line) in an acute brain slice prepared from a Hoxb8-IRES-Cre+/−; PC::G5-tdT+/−. The pseudocolor scale displays relative changes in GCaMP5G emission. (B) Representative individual traces of GCaMP5G fluorescence changes (ΔF/F0) in response to ATP administration. The color-coding of the traces matches the colored circles in panel A. (C) Histogram comparing the mean ATP-induced calcium increases in somas and processes of microglia (**p<0.01, ***p<0.0001 paired and unpaired t test before and after ATP or vehicle application, n=4-7 cells). (D) Histogram comparing the mean ATP-induced peak ΔF/F0 in the somas and processes of microglia with a single allele (heterozygous) and two alleles (homozygous) of GCaMP5G (*p<0.05, **p<0.01 paired and unpaired t test before and after ATP application, n=7-10 cells). All experiments were performed on 4-8 week old mice. Bar graphs display means ± SEM. See also Movie S6 and S7.

