Figure 3.

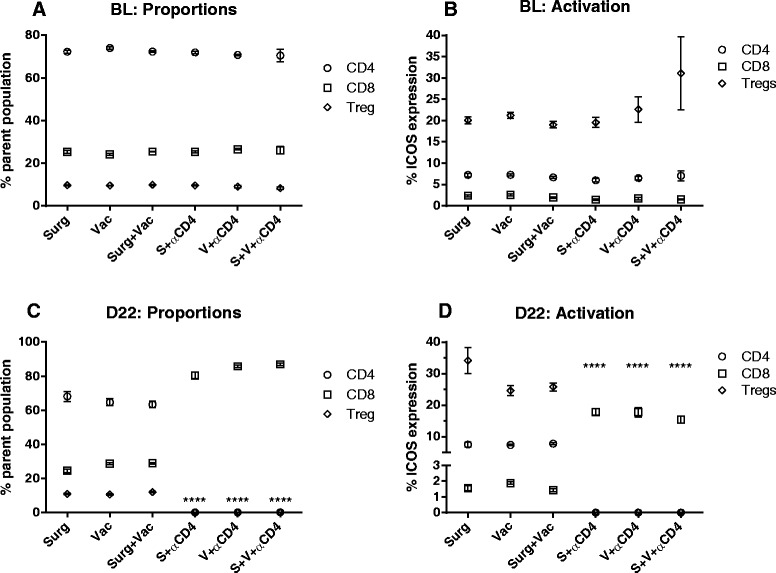
Enhanced CD8 T cell activation following CD4 Depletion. Flow cytometry analysis of pre (baseline) and post-treatment (day 22) peripheral blood lymphocytes taken from the same mice shown in Figure 2B. (A-B) The relative proportion and activation (ICOS) status of CD4, CD8 and Treg (CD4 + FoxP3+) lymphocyte subsets were similar between all groups prior to treatment. (C-D) CD4 T cell depletion resulted in a significant increase (****p < 0.0001) in the relative proportion and activation status of CD8 T cells (black squares) compared to the respective non-CD4 depleted groups.
