
Figure 4.
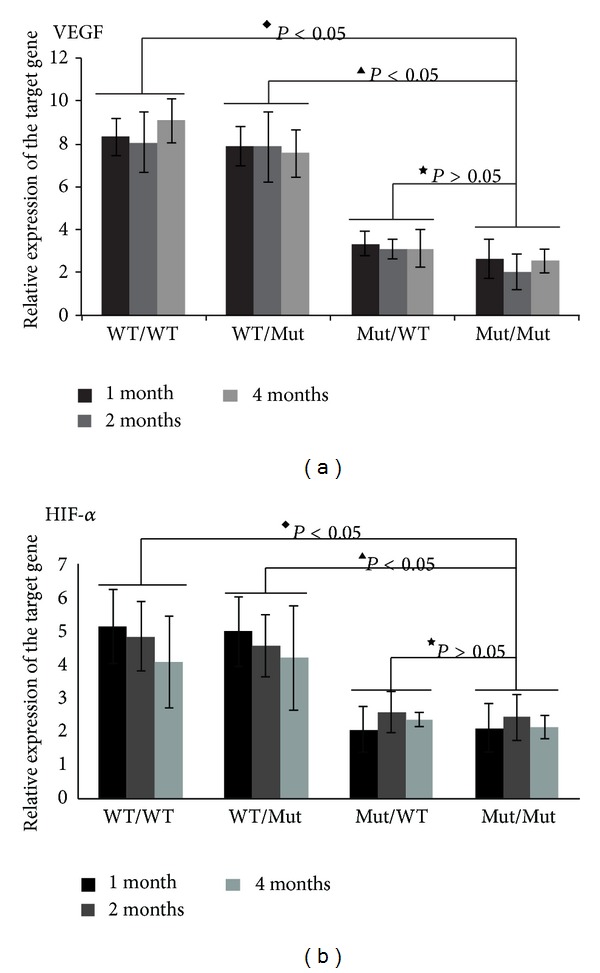
VEGF and HIF-1α mRNA expression in whole retinal tissue as detected by qt-PCR. The data are represented as the means ± SD (4–6 mice in each group), ◆ P < 0.05, compared between WT/WT and Mut/Mut groups; ▲ P < 0.05, compared between WT/Mut and Mut/Mut groups; ★ P > 0.05, compared between Mut/WT and Mut/Mut groups in the same time point.