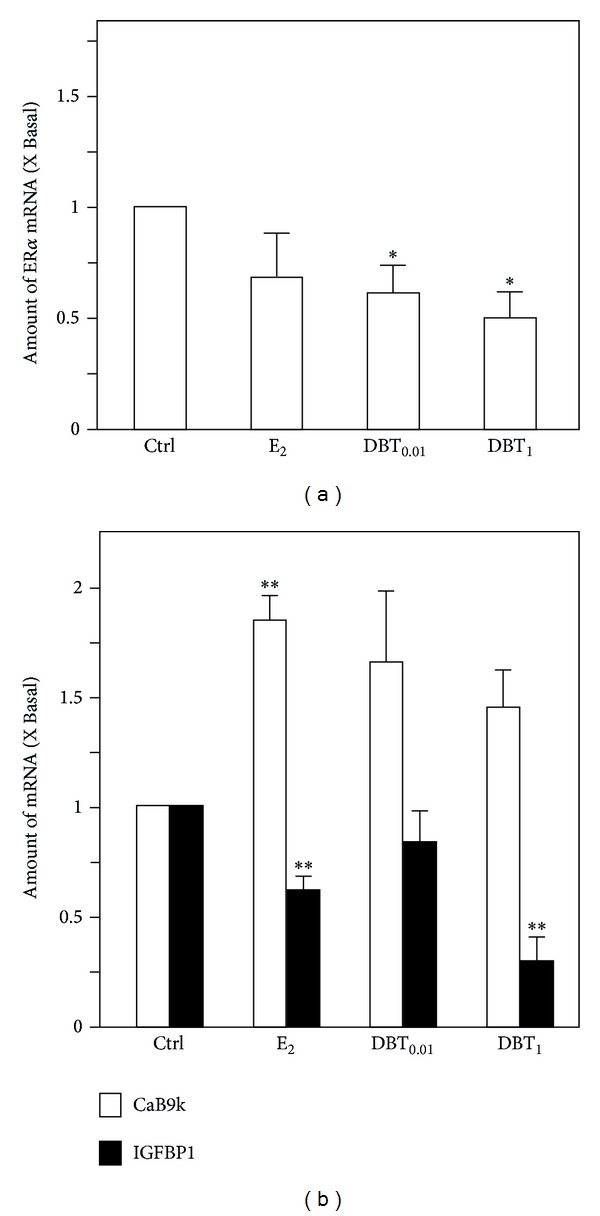
Figure 4.

Regulation of expression of estrogen receptors and estrogen response genes in livers. The mRNA expression of ERα in livers (a) and the mRNA expression of the estrogen response genes including CaBP9k and IGFBP1 in livers (b) were analyzed by quantitative real-time PCR analysis. Asterisks indicate values significantly different from the respective controls. *P < 0.05, **P < 0.01, and ***P < 0.001.
