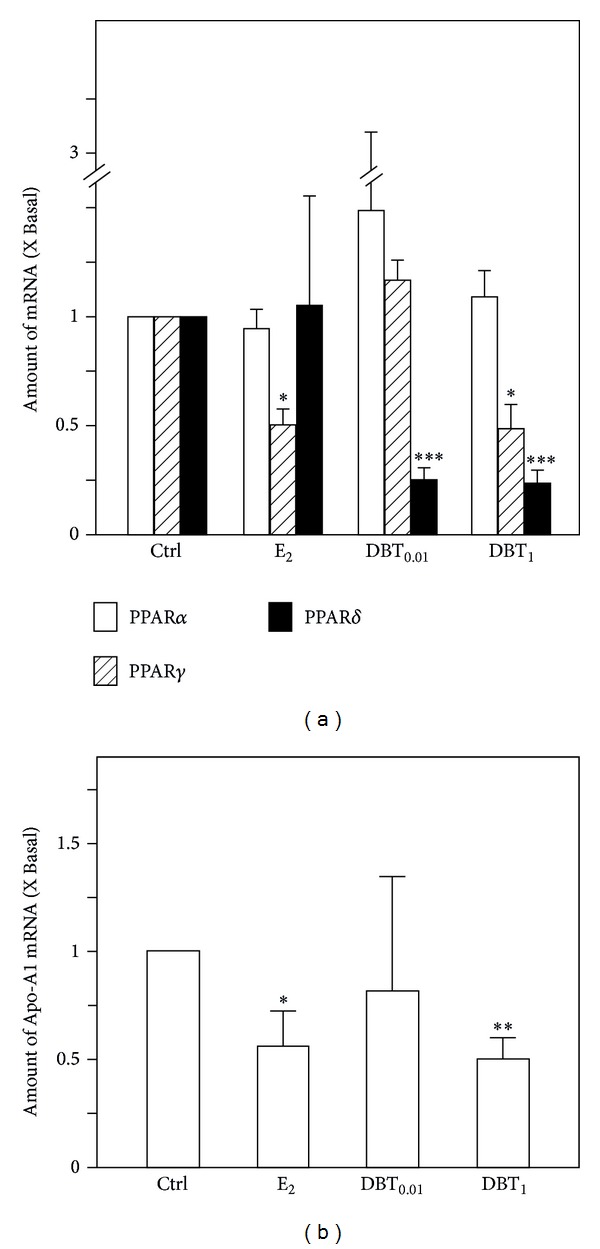
Figure 5.

The gene expression of peroxisome proliferator-activated receptors and Apo-A1 in livers. (a) The mRNA expression of PPARα, PPARγ, and PPARδ in livers was analyzed by quantitative real-time PCR analysis. (b) The mRNA expression of Apo-A1 in livers was analyzed by quantitative real-time PCR analysis. Asterisks indicate values significantly different from the respective controls. *P < 0.05, **P < 0.01, and ***P < 0.001.
