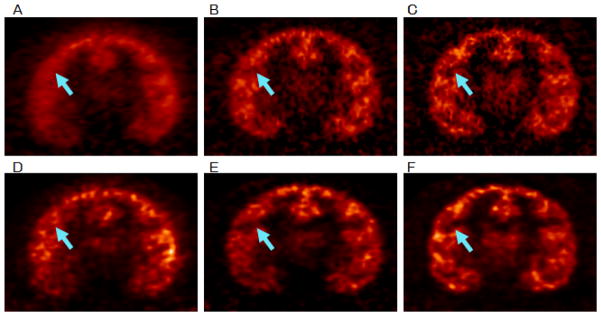
Fig. 4.

Nonhuman primate (NHP) images for an awake study (A, B, D and E) ([11C]flumazenil, with data taken from 30 to 60 min postinjection) and an anesthetized study (C and F) using the same tracer with comparable counts in the same animal. The top row shows the images reconstructed with FBP of (A) an awake study without motion correction, (B) with MAF motion correction, and (C) an anesthetized study. The bottom row shows the images reconstructed with MOLAR of (D) the awake study without motion correction, (E) with EBE motion correction and (F) the anesthetized study. All images were registered to an NHP template, and are displayed on a common scale. As indicated by the arrows, the contrasts of the cortical structures are comparable in E and F, whereas some blurring is observed in B compared with C, due to the residual intra-frame motion of the MAF method.
