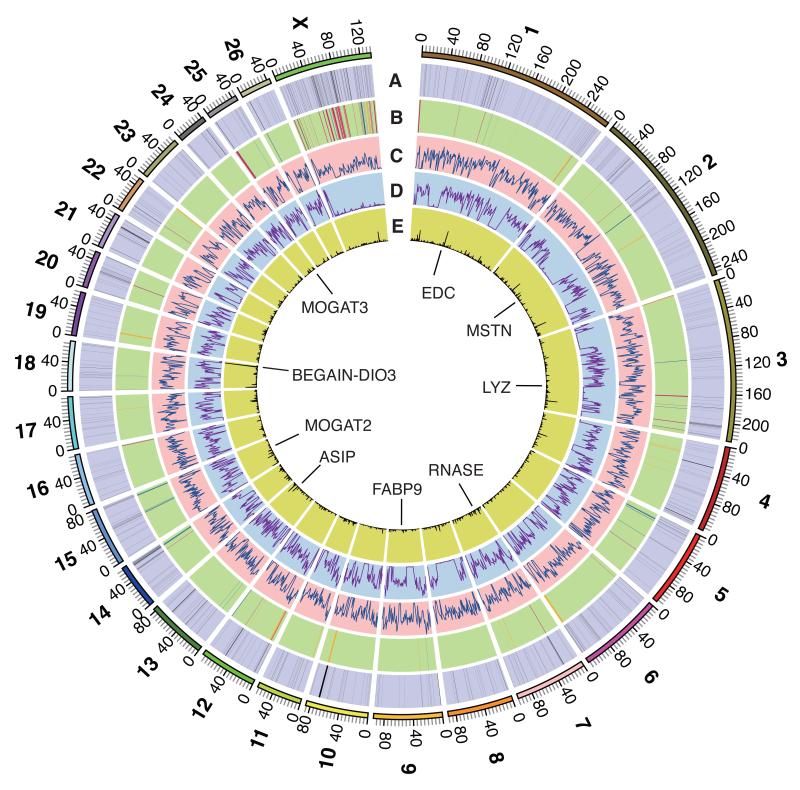
Fig. 1. The genome of sheep.
(A) 1,097 segmental duplications (length >5 kb) in the two Texel sheep (10). (B) Sheep vs. cattle chromosome break points (10), gaps in Oar v3.1 are red, probable misassemblies in UMD 3.1 are yellow and probable true structural differences are blue. (C) Distribution of SNPs in the Texel ewe in 1Mb non-overlapping windows, range of values 1 to 4954. (D) Distribution of SNPs in the Texel ram in 1 Mb non-overlapping windows, range of values 3 to 5676. (E) Distribution of mono-allelically expressed SNPs in 500kb sliding windows, range of values 0 to 42 (10). The scale is in Mb. Positions of loci discussed in the text are indicated.

