
Figure 3. Principal Coordinates Analysis (PcoA) of the host range phenotypes.
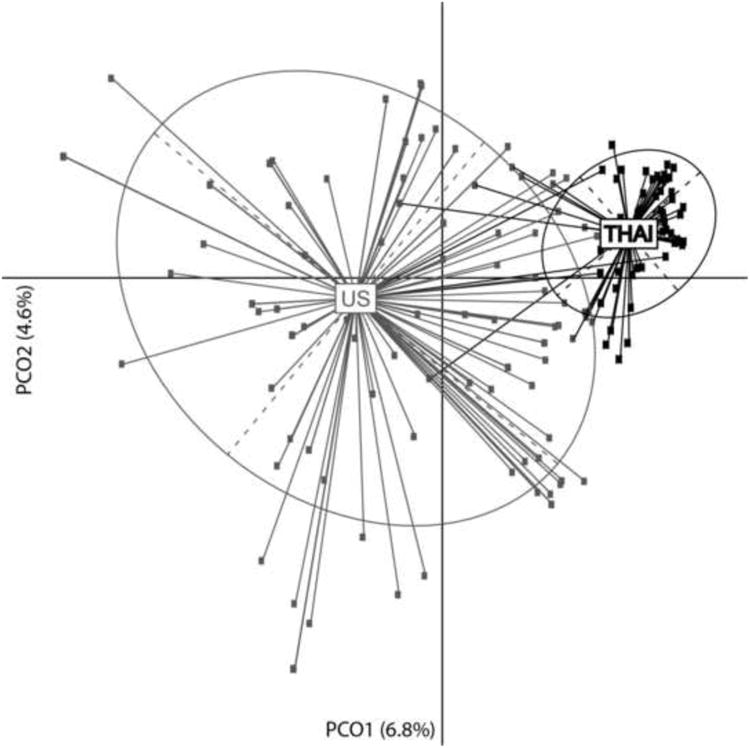
In gray are the U.S. phage isolates, in black are the Thai phage isolates. X-axis is the first source of variation that distinguished U.S. and Thai phages and Y-axis is the second source of variation that shows the diversity within U.S phage isolates. The two components explained 6.8% and 4.6% of the variance, respectively. Four Thai phage isolates exhibited host ranges similar to those observed in the U.S. phage isolates and five U.S. phage isolates exhibited host ranges similar to those observed in the Thai phage isolates.