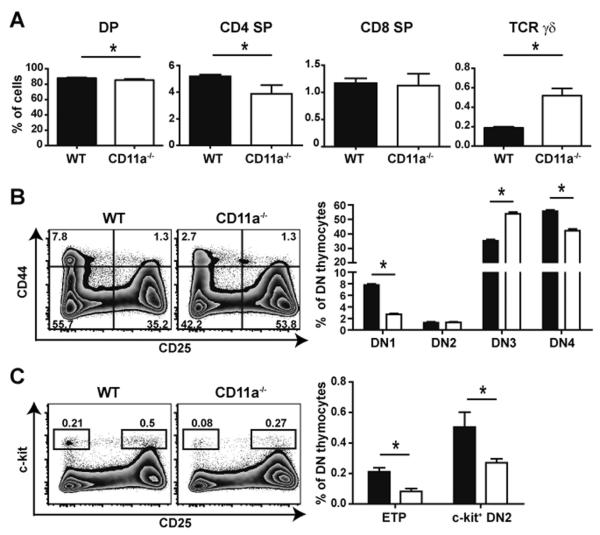
Figure 3. CD11a−/− mice exhibit reduced frequencies of thymic ETPs but do not have an additional developmental block in differentiation.
(A) Thymi of WT and CD11a−/− mice were stained with antibodies against cell surface markers to identify immature and mature thymocytes by flow cytometry. Bar graphs show a comparison of DP (CD3−CD4+CD8+), CD4 SP (CD3+TCRγδ−CD4+CD8−), CD8 SP (CD3+TCRγδ−CD8+CD4−) and TCR γδ T cells (CD3+TCRγδ+) in either WT (black bars) or CD11a−/− mice (white bars). Representative zebra plots show differences between the WT and CD11a−/− thymus in regards to DN subsets using CD44 versus CD25 expression (B) or ETP and DN2 subsets using c-kit versus CD25 expression (C). Bar graphs show mean frequencies of indicated DN thymocyte subsets. Error bars represent SEM with 5 mice per group that ranged in age from 8–12 weeks. * p < 0.05. Data are representative of 3 individual experiments with 4–5 mice in each group.

