Figure 4.

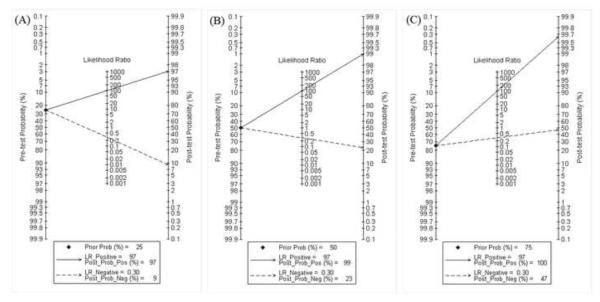
Fagan plot analysis to evaluate the clinical utility of the immunochromatography method. (A) Pre-test probability = 25%. (B) Pre-test probability = 50%. (C) Pre-test probability = 75%. [Au?18]

Fagan plot analysis to evaluate the clinical utility of the immunochromatography method. (A) Pre-test probability = 25%. (B) Pre-test probability = 50%. (C) Pre-test probability = 75%. [Au?18]