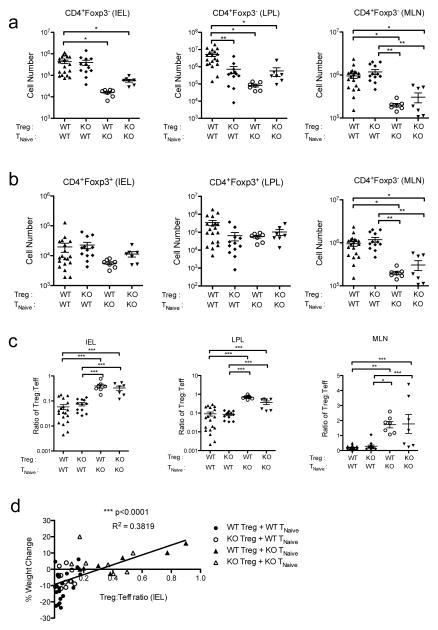
Figure 5. Type I IFNs directly promote effector T cell expansion in Trex1−/− mice.
a, b) Summary of the absolute number of CD45.1+CD4+Foxp3− effector T cells (Teff) (a) and CD45.2+CD4+Foxp3+ Treg cells (b) in the mesenteric lymph node (MLN) (right), and IEL (left) and LPL (middle) of the colons of Rag2−/−Trex1−/− mice receiving the indicated combinations of CD45.2+ WT or Ifnar1−/− (knockout, “KO”) Treg and CD45.1+ TNaive cells. c) Summary of the ratio of Treg to Teff cells in the MLN (right) and IEL (left) and LPL (middle) of the colons of Rag2−/−Trex1−/− mice receiving the indicated combinations of CD45.2+ WT or Ifnar1−/− (knockout, “KO”) Treg and CD45.1+ TNaive cells. d) Correlation plot comparing the Treg:Teff ratio in the IEL of the colon to the percent weight change at time of sacrifice in Rag2−/−Trex1−/− mice receiving the indicated combinations of WT or Ifnar1−/− (knockout, “KO”) Treg and TNaive cells. Data are summarized from 8 independent experiments 3–4 mice per group. Statistical significance was determined using one-way ANOVA with Tukey post-test (a–c) or by linear regression slope test. *, p<0.05; **, p<0.005; ***, p<0.0001.

