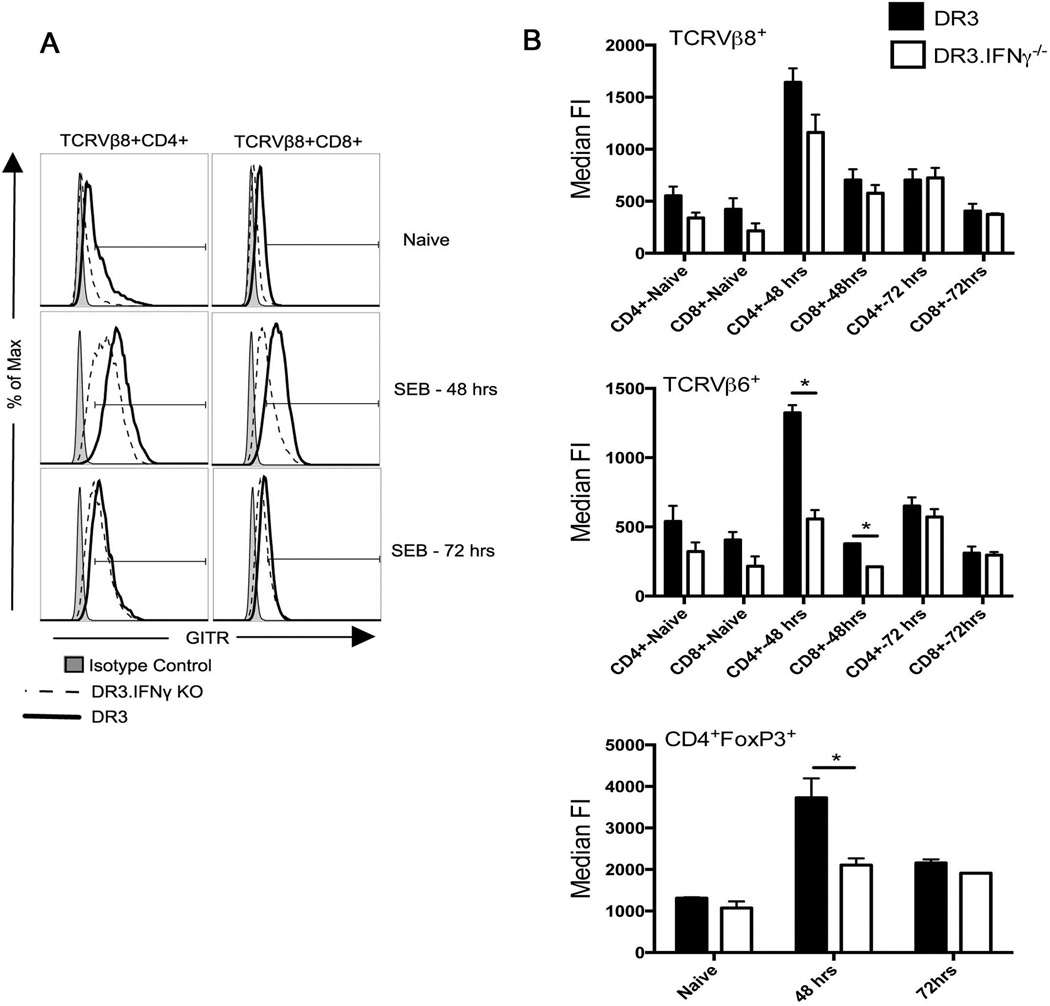
Figure 9. Role of IFN-γ on upregulation of GITR on Tconv and Tregs cells during TSS.
IFN-γ-sufficient and IFN-γ-deficient HLA-DR3 transgenic mice were challenged with SEB (10 µg/mouse). Mice were killed 48 or 72 hours later, splenocytes isolated and stained with indicated antibodies. (A) Representative histogram overlays depicting the expression profile of GITR on indicated gated population (B) Bar charts depicting median fluorescent intensity of GITR expression (mean±SE) on cells within the indicated gates. * p<0.05 between IFN-γ-sufficient and IFN-γ-deficient group.

