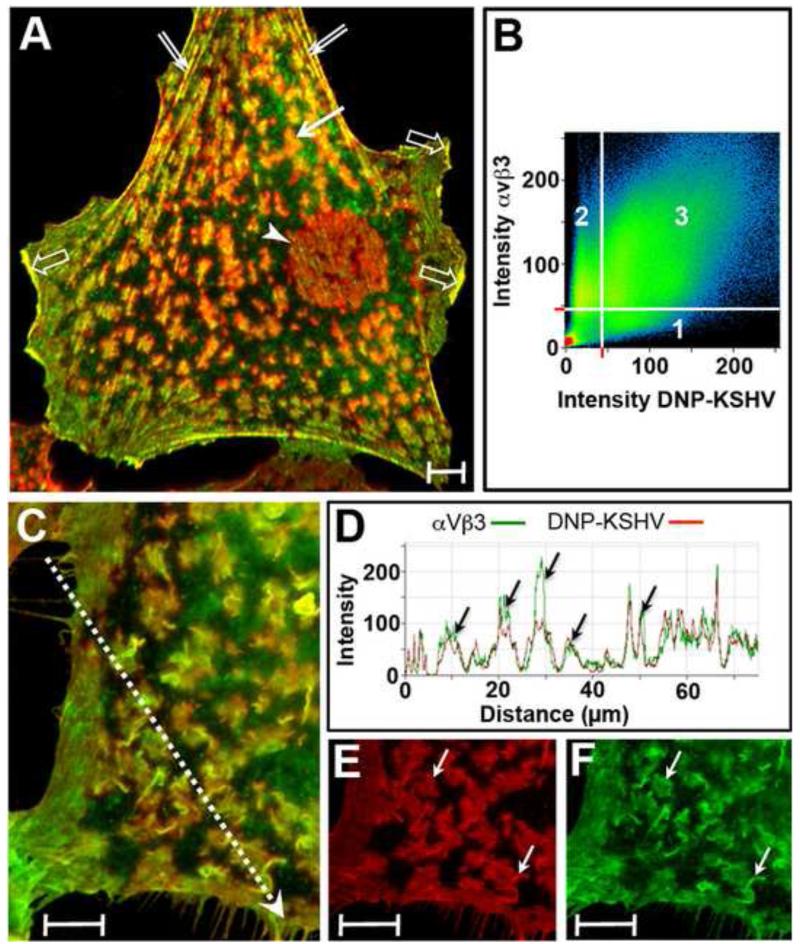
Figure 2. Colocalization of KSHV-binding sites and αVβ3 integrin on cell surface membrane structures.
A) HT1080 cells were fixed and incubated with anti-β3 integrin antibody and DNP-KSHV and the fluorescent signals were sequentially enhanced with TSA 488 (anti-β3, green) and TSA 647 (anti-DNP, red). Colocalized β3 integrin and bound KSHV appears yellow/orange. Manders overlap coefficients M1 and M2, determined by the Zeiss LSM Pascal software, were 0.88 and 0.79, respectively, where M1 indicates the percentage of DNP-KSHV detected that overlaps with αVβ3, and M2 indicates the percentage of the αVβ3 detected that overlaps with DNP-KSHV. B) A scattergram of the αVβ3 (green) and KSHV (red) pixels in panel A. C) The dorsal surface of another cell was analyzed at a higher magnification to measure fluorescent intensities for β3 integrin (green) and bound KSHV (red) along the dashed arrow. D) Histogram of the fluorescent intensities along the arrow in (C). Topography of bound KSHV (E) is shown compared to αVβ3 integrin (F). The merged image of this cell is shown in panel C. Bar = 10μm

