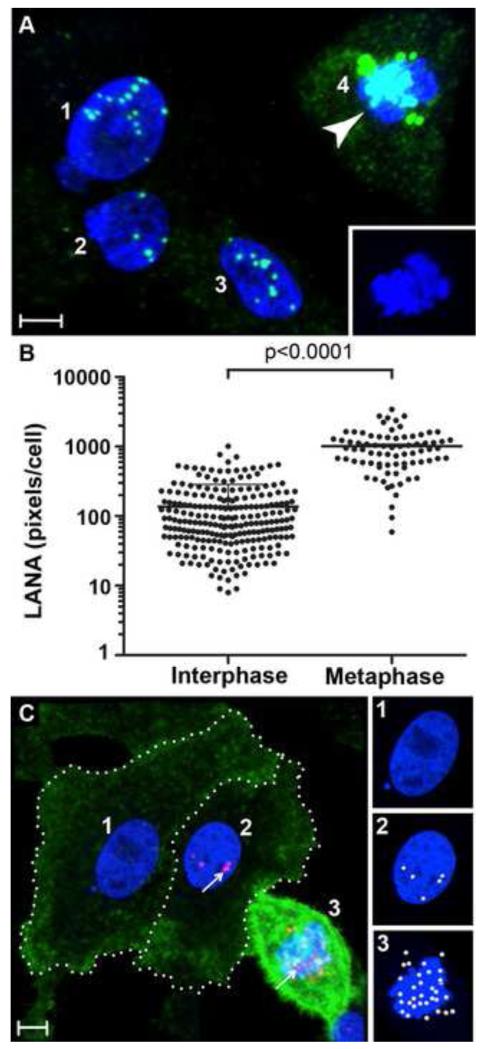
Figure 4. Increased KSHV LANA expression in infected mitotic cells with up-regulated αVβ3 integrin.
A-C) HT1080 cells were infected with unlabeled KSHV and incubated for 24 hours. A, B) infected cells were fixed and stained for KSHV LANA (green) using TSA 488. Nuclear DNA was stained with TO-PRO 3 (blue). A) Representative LANA staining in mitotic cell #4, (arrowhead) and interphase cells #1-3. Inset shows condensed chromatin of the mitotic cell #4, blue channel only. B) Quantitation of LANA pixels/cell for interphase (n=235) and metaphase (n=77) cells showing mean and standard deviation. C) infected cells were sequentially stained for cell surface αVβ3 integrin (green) and nuclear KSHV LANA (red) using TSA 488 and TSA 594, respectively. Cells #1 and 2 (dotted outlines) had nuclei with diffuse chromatin characteristic of interphase cells, while cell #3 had condensed chromatin characteristic of a mitotic cell. The individual nuclei of cells #1-3 are shown at the right (insets) with LANA dots rendered as spheres with the green fluorescence channel off to better visualize the chromatin. Quantitation of LANA dots revealed 0, 5 and 32 LANA dots in cells #1, 2 and 3, respectively. This data is representative of the staining on other cells in the culture. Bar = 10μm

