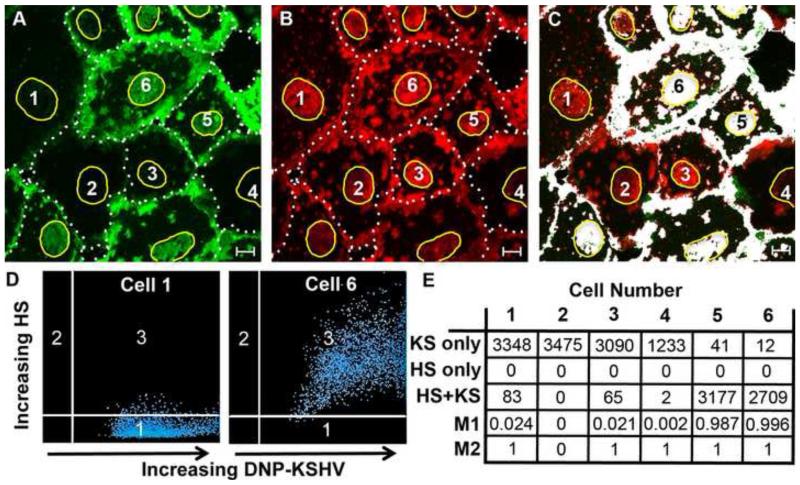
Figure 8. Localization of HS and KSHV-binding sites on cell surface structures.
Fixed HT1080 cells were incubated with DNP-KSHV and stained with anti-HS antibody (10E4) using sequential enhancement with TSA 647 and TSA 488, respectively. The micrographs are of the same field showing the distribution of A) HS (green), B) DNP-KSHV (red), and C) colocalization (white). Cell borders are indicated with a dashed line. D) Scattergrams comparing pixel intensities of cells #1 and 6; KSHV (quadrant 1), HS (quadrant 2), and colocalized pixels (quadrant 3). The yellow outline in A-C marks the nuclear edge within which a 65μm2 ROI for cells #1-6 was selected for the quantitation. E) pixel counts in the R0I for KSHV-only (red), HS only (green), HS+KSHV colocalized pixels (white). Manders colocalization coefficients (M1 and M2) were determined for each cell within the ROI, where M1 indicates the percentage of bound KSHV that overlaps with HS and M2 indicates the percentage of HS-containing sites that overlap with bound KSHV. Bar = 10μm

