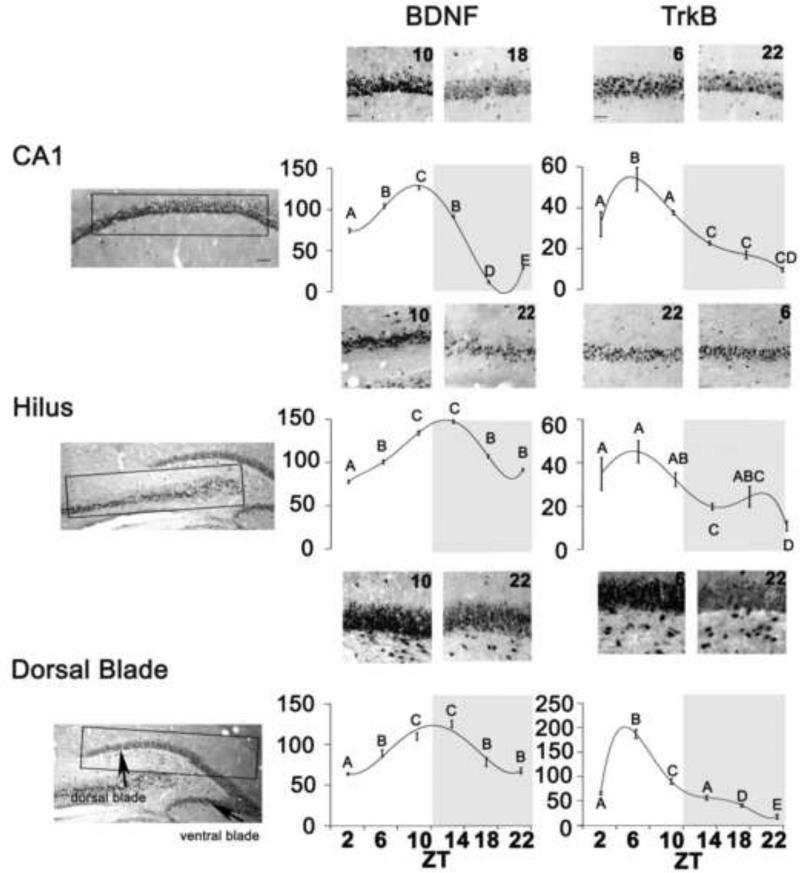
Figure 4. Rhythms in Plasticity gene products.
Left Panels: Sampling boxes (rectangles) were used for cell counts in of the CA1, dorsal blades of the DG, and hilus as described in Materials and Methods. Anatomical boundaries are based on Paxinos and Watson (1997). CA1, DG, dentate gyrus; ZT, Zeitgeber Time. Center and Right Panels: Photomicrographs depicting BDNF and Trk B expression at two different ZTs. Scale bar represent 200μm. Line charts showing the mean (+ SEM) number of BDNF (Center) and TrkB (Right) expressing cells for each ZT in the CA1, dorsal blade of the DG, and hilus of male grass rats. Significant differences between ZTs (p<0.001) are noted by different letters. Grey region on each chart indicates the dark phase of the cycle.

