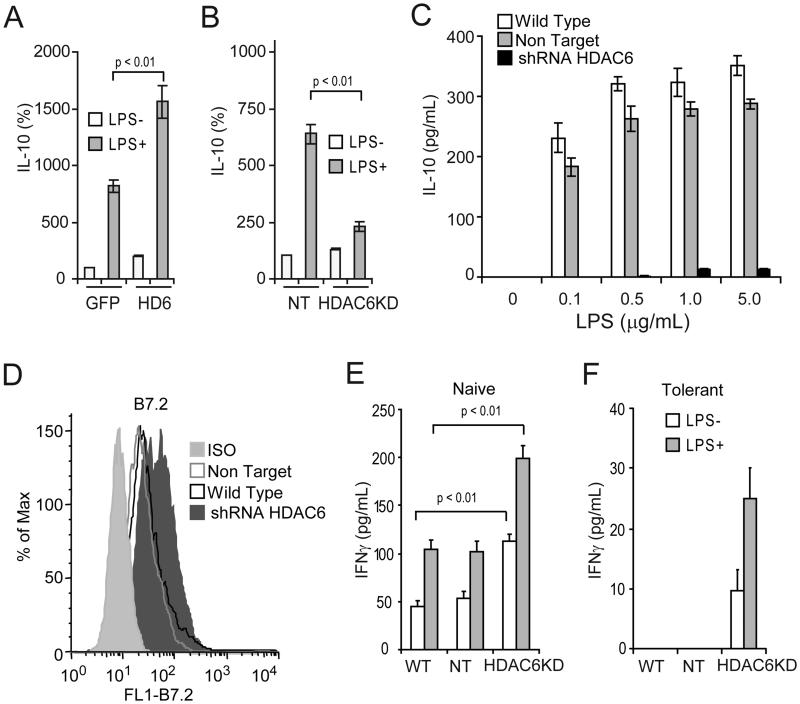
Figure 1. Phenotypic and functional analysis of macrophages lacking HDAC6.
RAW264.7 cells were transduced in vitro with adenovirus carrying GFP-HDAC6 (HD6) or GFP alone (A), or with lentiviral particles containing HDAC6-specific shRNA (HDAC6KD) or non-targeting shRNA control (NT) (B). Forty-eight hours later cells were treated with or without LPS (1 μg/ml) for additional two hours. Then, total RNA was isolated and expression of IL-10 and GAPDH was measured by quantitative real-time RT-PCR. The results are expressed as percent over control cells transduced with GFP alone (panel A) or non-target shRNA (panel B) and data were normalized by GAPDH expression. Three experiments were performed with similar results. Error bars represent standard deviation from triplicates. (C) Wild type RAW264.7 (WT), non-target (NT) or HDAC6KD (shRNAHDAC6) cells were stimulated with increasing concentrations of LPS (0.1-5.0 μg/ml) for 24 hours. Then, IL-10 production was determined by ELISA. Two experiments were performed with similar results. Error bars represent standard deviation from triplicates. (D) The expression of B7.2 on LPS-stimulated macrophage clones was determined by flow cytometry. In a parallel experiment, 1×10⁵/well RAW264.7 cells lacking HDAC6 or control cells were treated with or without LPS (1 μg/ml) for 24 hours (open bars: −LPS, gray bars: +LPS). Then, 5×10⁴ purified naïve (E) or tolerized (F) anti-HA CD4+ T cells were added to the cultures in the presence of 12.5 μg/ml of cognate HA-peptide110-120 (SFERFEIFPKE). After 48 hours, IFN-γ production was determined by ELISA. Three experiments were performed with similar results. Error bars represent standard deviation from triplicates.

