
Figure 2.
Functional Analysis of Mutated FEZF1
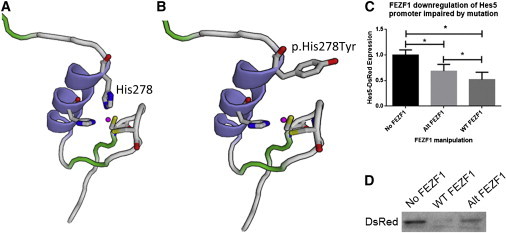
(A) Predicted 3D model of the zinc-finger domain containing histidine 278. Histidine residues (blue) are shown alongside cysteine (yellow) and bound zinc.
(B) Predicted 3D model of the altered FEZF1, in which histidine 278 changed to a tyrosine, from family 1.
(C) Analysis of DsRed band optical density (normalized to tubulin) with either no FEZF1, altered FEZF1, or wild-type FEZF1. Histograms show the mean, and error bars represent the SE (∗p < 0.05, repeated-measures one-way ANOVA with the Holm-Sidak posttest).
(D) Example of an immunoblot showing Hes5-DsRed levels when cotransfected with no FEZF1 (left), altered FEZF1 (middle), or wild-type FEZF1 (right). Immunoblot analysis was performed according to standard protocols. Protein was extracted 24 hr after transfection. Fifty micrograms of total protein was denatured, subsequently loaded into a 7.5% gel, and then separated. Protein was then transferred to a polyvinylidene fluoride membrane, blocked, and incubated in primary antibody overnight. Then the membranes were washed, subsequently incubated with horseradish-peroxidase-conjugated secondary antibody for 2 hr, and visualized with an enhanced chemiluminescence reaction. Band density was quantified with ImageJ. DsRed band density was normalized to β-tubulin levels. Rabbit anti-human ZNF312B (FEZF1, Abcam, catalog no. ab81251, 1:1,000), anti-DsRed (Clontech, catalog no. 632496, 1:1,000), mouse anti-β-tubulin (Sigma, catalog no. T4026, 1:1,000), anti-rabbit HRP (Cell Signaling, catalog no. 7074, 1:5,000), anti-mouse HRP (Cell Signaling, catalog no. 7076, 1:5,000) antibodies were used in these experiments. Statistical significance was determined with Prism (GraphPad).