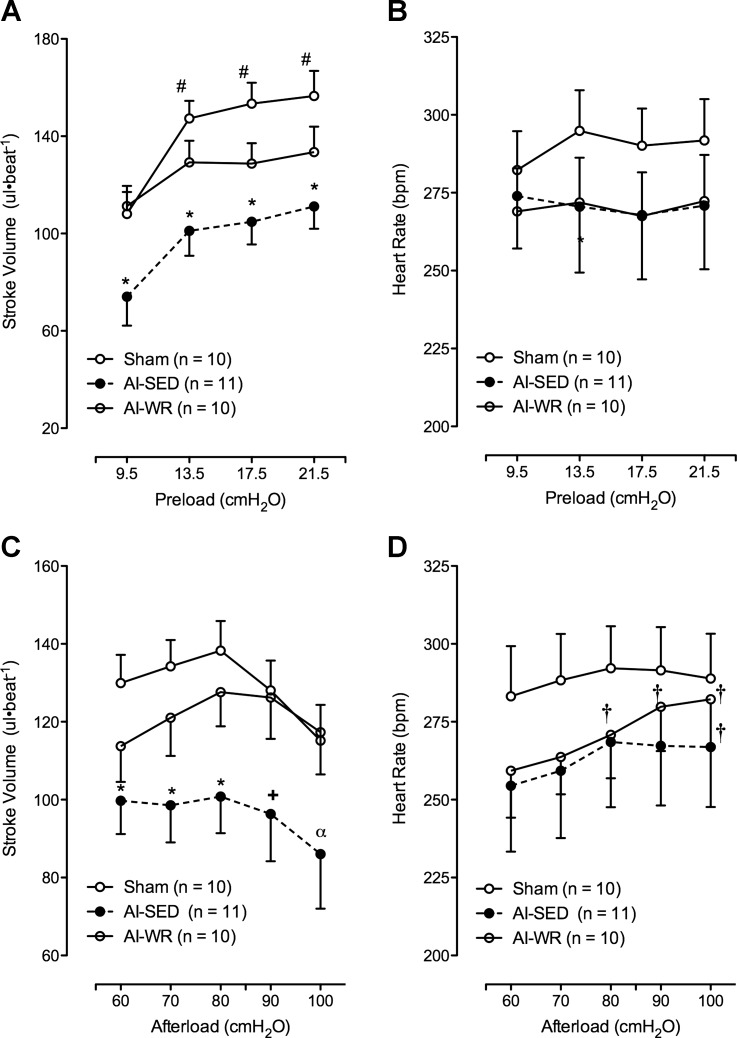
Fig. 2.
Stroke volume and heart rate responses to preload and afterload manipulations. Stroke volume was impaired similarly to CO in AI-SED hearts in response to altering preload (A) and afterload (C) while not different from sham in the AI-WR hearts. In contrast, heart rate was not different between groups during both manipulations (B and D). Moreover, heart rate did not change with increasing preload (B) but may have contributed to changes in CO with increasing afterload in both AI groups (D). *P < 0.05 vs. sham; +P = 0.07 vs. sham; αP = 0.12 vs. sham; #P < 0.05 vs. 9.5 cmH20 value; †P < 0.05 vs. 60 cmH2O value.

