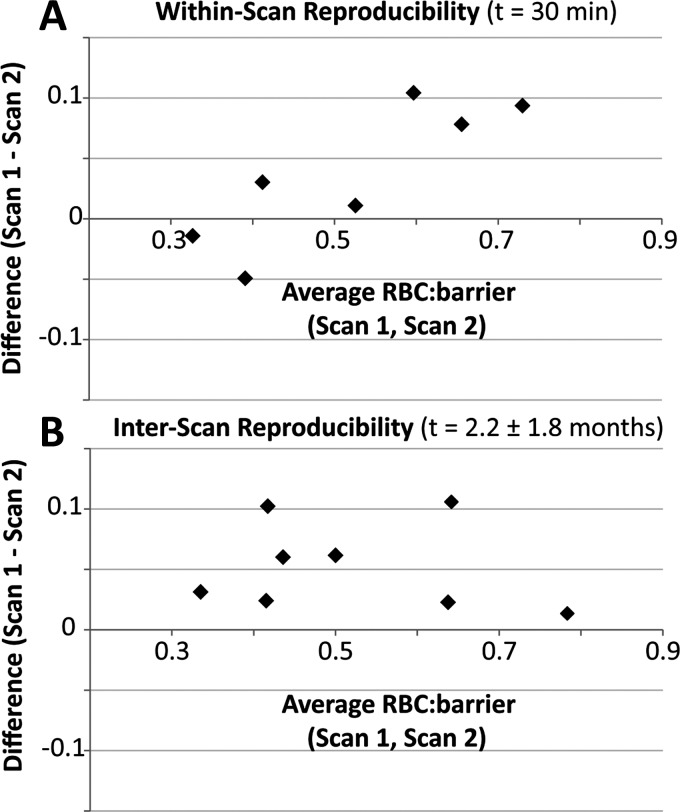
Fig. 5.
Bland-Altman plots showing the reproducibility of the RBC:barrier ratio. A: within a given session, RBC:barrier had a variability of 6.6%, which was not significant. B: over different scanning sessions, RBC:barrier was significantly reduced in the follow-up session (P = 0.01), with a mean variability of 8.25%.

