Fig. 10.
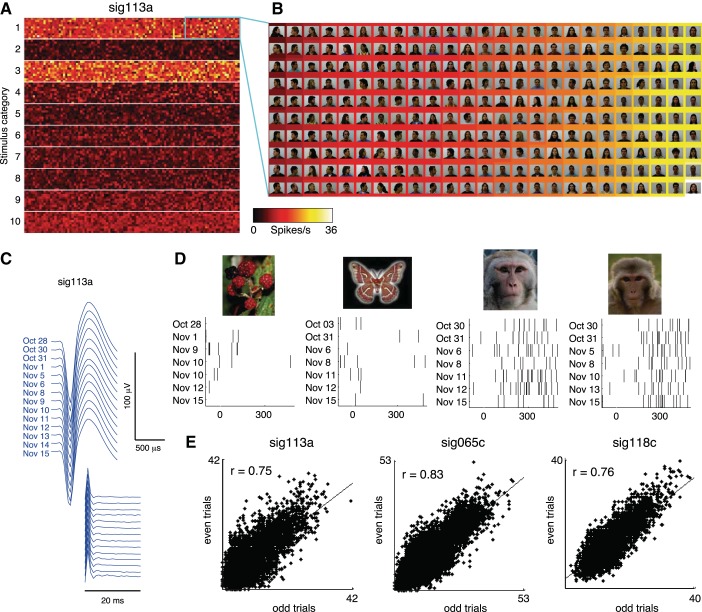
Single-neuron responses to 10,000 stimuli. A: responses of 1 neuron to 10,000 stimuli collected over the course of 19 days, displayed in a 100 × 100 pixel matrix. The color of each pixel indicates the neuron's response to 1 stimulus, based on the mean of 7 or 8 trials collected between October 28 and November 15, 2012. The stimulus set comprised 1,000 images drawn from 10 categories: 1) human faces, 2) human bodies, 3) monkey faces, 4) monkey bodies, 5) birds, 6) butterflies, 7) plants, 8) man-made objects, 9) scenes, and 10) Fourier descriptors. The high firing rates evident as hot colors in the 1st and 3rd rows of the heat map indicate responses to human and monkey faces, respectively. B: detail of 250 human faces [representing 2.5% of the complete stimulus matrix; reproduced from the FEI face database (Thomaz and Giraldi 2010) with permission], sorted by response strength. Stimuli were sorted by the neuron's firing rate (indicated by background color) in order of weakest (top left) to strongest (bottom right). Note the neuron's stronger responses to frontal face views (hot colors on right) compared with profile views. C: spike waveform and ISI histograms from the neuron recorded in sessions between October 28 and November 15. D: raster plots of spikes fired by the neuron upon presentation of 4 stimuli. Consecutive trials rarely occurred on the same day (because of the large size of the stimulus set), and could occur >1 wk apart. E: split-halves correlations showing the consistency of stimulus selectivity for the neuron shown in A–D and 2 other neurons. Correlation coefficients were computed between the responses to all stimuli averaged over the odd vs. even trials from all days.

