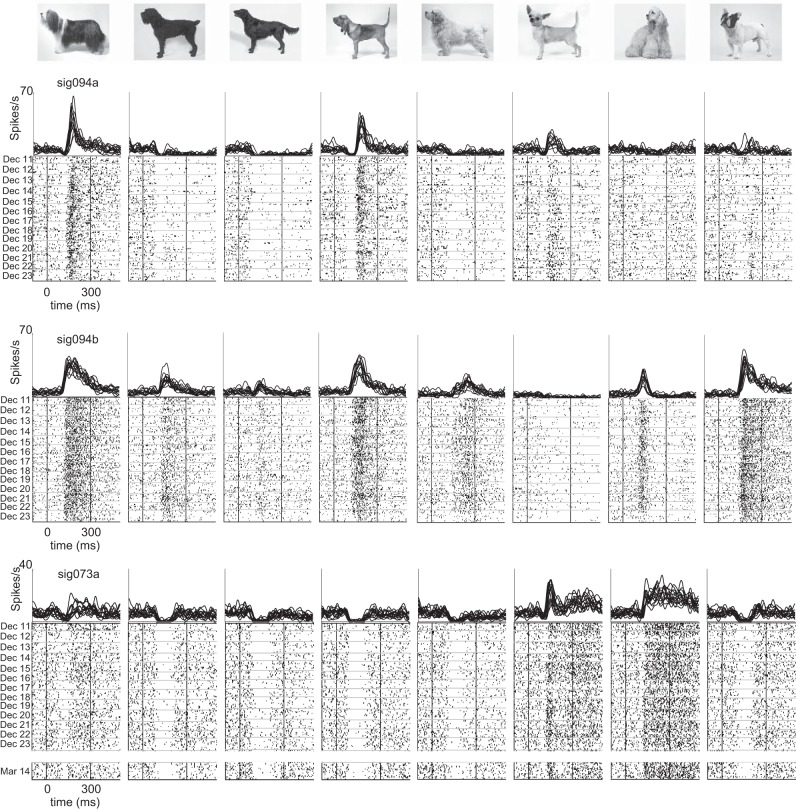
Fig. 4.
Consistency of visual responses in longitudinally monitored neurons. Responses of the same 3 neurons shown in Fig. 3 to 8 images selected from a set of 96 stimuli that were presented in daily screening sessions. Daily averages of firing rate histograms (top) show visual responses obtained between December 11 and 23, 2012 for all neurons. A 14th session obtained on March 14, 2013 is included for 1 neuron (sig073a). Raster plots (bottom) show each trial sorted from top to bottom in chronological order. Horizontal lines in the raster plots indicate the breaks between days.

