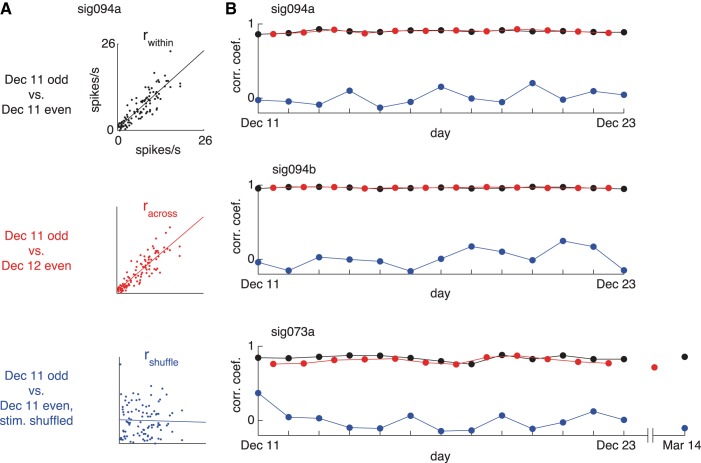
Fig. 5.
Longitudinal time course of stimulus selectivity patterns. A: scatterplots comparing the responses of neuron sig094a after dividing the data into split halves of equal size. Top: within-day correlation (rwithin) computed between the mean responses to 96 stimuli on odd vs. even trials collected on the same day (December 11). Middle: across-day correlation (racross) computed in the same way but using split halves drawn from consecutive days (December 11 and 12). Bottom: stimulus-shuffled correlation (rshuffle) computed between single-day split halves after shuffling one of the halves. B: time course across days of stimulus selectivity metrics (computed as in A) for 3 neurons. Same cells as shown in Figs. 3 and 4.

