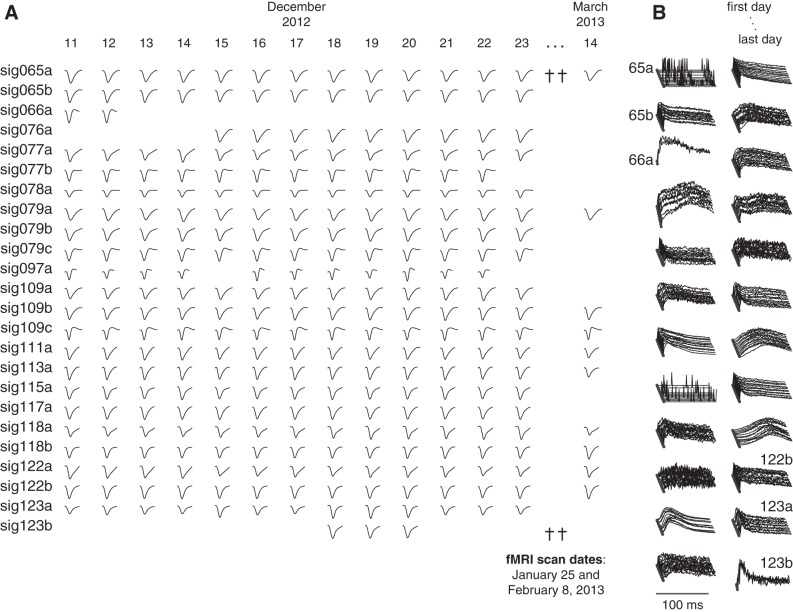
Fig. 6.
Population of simultaneously recorded spikes from 1 longitudinal data set. A: normalized voltage traces showing the shape of the waveforms for the remainder of the neurons collected from December 11, 2012 to March 14, 2013. Functional MRI scans were conducted on 2 days in the intervening period (daggers, January 25 and February 8, 2013), which did not interfere with the ability to follow the same spikes before and after the scanning sessions. The complete population of neurons in the longitudinal session comprises the 24 neurons shown here together with the 3 neurons shown in expanded detail in Figs. 3–5. B: daily-averaged ISI histograms for the neurons shown in A.

