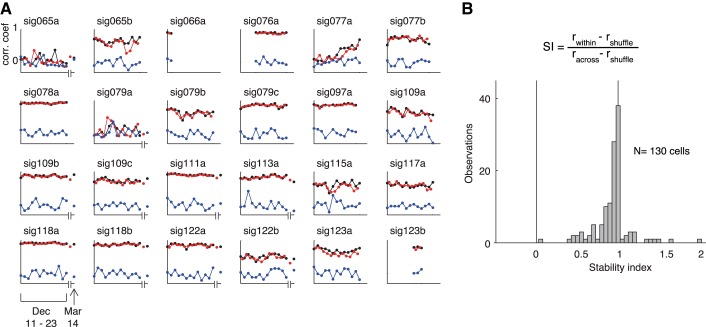
Fig. 7.
Time course of stimulus selectivity patterns for 24 neurons. A: time course of split-halves correlation coefficients rwithin, racross, and rshuffle for the 24 neurons shown in Fig. 6. Graphic conventions as in Fig. 5. B: distribution of stability index (SI) for 130 neurons recorded in all 7 longitudinal experiments.

