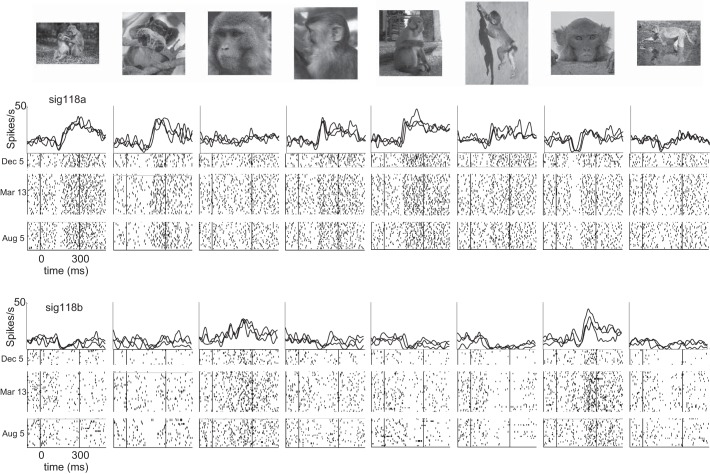
Fig. 9.
Consistent patterns of visual responses observed intermittently in 2 neurons over 8 mo. Firing rate histograms show the daily-averaged visual responses of 2 neurons recorded on the same microwire in occasional experimental sessions separated by several months (December 5, 2012, March 13, 2013, and August 5, 2013). The same set of 96 stimuli was presented in each of these 3 recording sessions. Graphic conventions as in Fig. 4.

