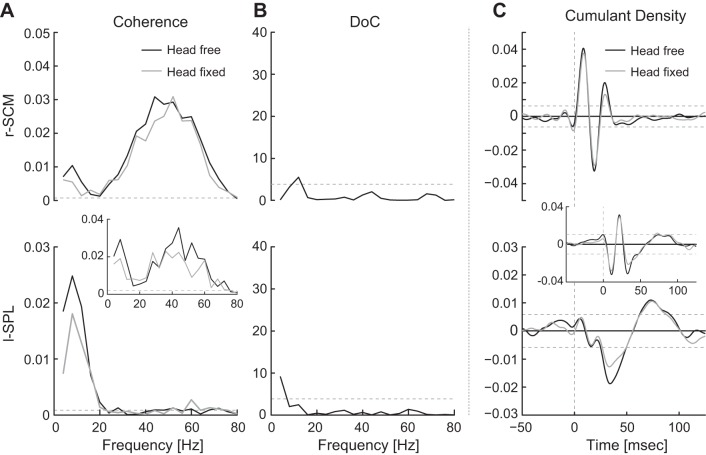
Fig. 3.
Comparison of head-free and head-fixed conditions (blocks 1a and 1b). A: pooled (n = 8, r-SCM; n = 7, l-SPL) coherence plots. Pooled coherences (n = 3) for l-SPL using data from 3 subjects are included as an inset to detail high-frequency coherence for these subjects. Horizontal dashed lines indicate 95% confidence limits. B: difference of coherence (DoC) test comparing free and fixed conditions. Horizontal dashed lines represent significance level for the χ2-distribution (P = 0.05). C: pooled (n = 8, r-SCM; n = 7, l-SPL) cumulant density estimate showing a triphasic r-SCM and a biphasic l-SPL response. Pooled cumulant density estimates (n = 3) for l-SPL using data from 3 subjects are included as an inset to detail the additional short-latency biphasic waveform for these subjects. Horizontal dashed lines represent 95% confidence interval.

