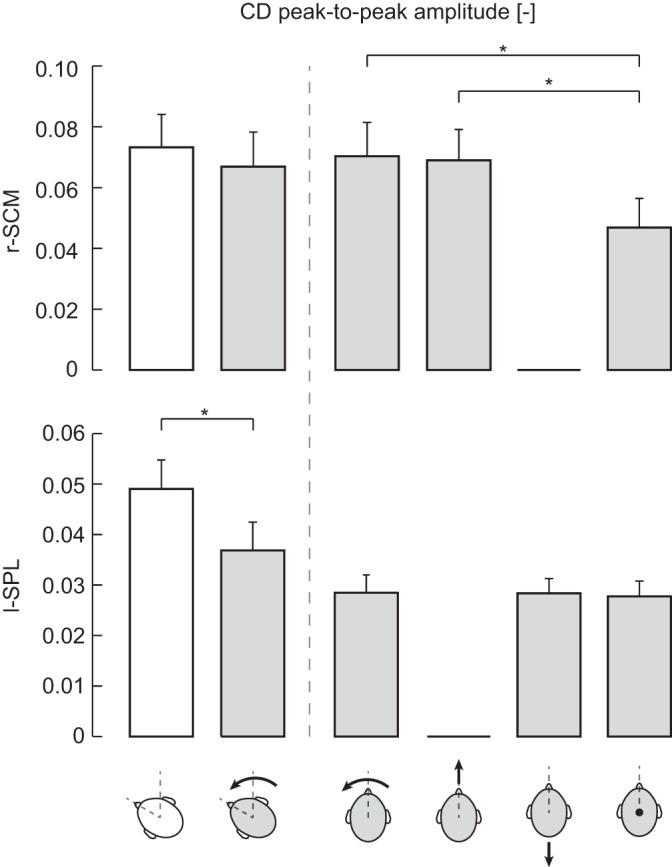
Fig. 5.

Mean cumulant density (CD) peak-to-peak amplitudes for the r-SCM (top) and l-SPL (bottom) muscles for all conditions. Error bars represent SE (r-SCM: n = 8; l-SPL: n = 7). Extension for r-SCM and flexion for l-SPL are not plotted because no significant cumulant density responses were detected. Head-free and -fixed conditions are represented as open and shaded heads, respectively. Accompanying arrows indicate the direction of load applied by subjects in fixed conditions.
