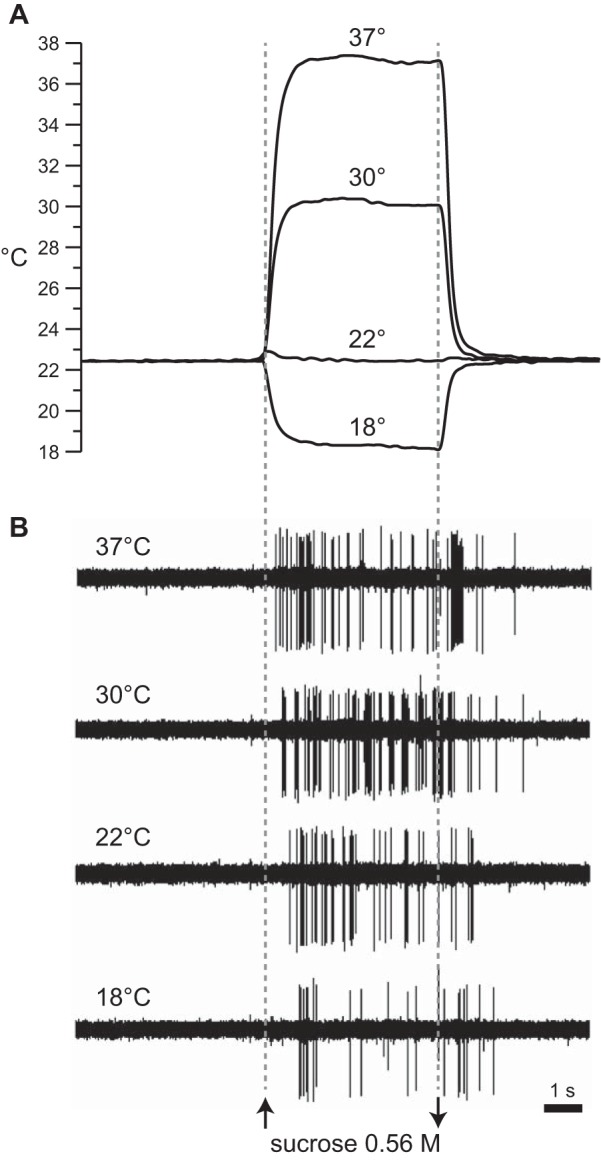
Fig. 1.

Example recordings from 1 S-type neuron. A: family of traces depicting real-time measurement of rinse and stimulus temperature, at the moment of oral delivery, on 4 separate trials where a fixed concentration of sucrose (0.56 M) was tested at 18°C, 22°C, 30°C, and 37°C. B: electrophysiological sweeps depicting trains of action potentials recorded in synchrony with temperature during each trial in A. Sweeps are aligned by time of stimulus onset (see materials and methods). Upward and downward arrows indicate stimulus onset and offset, respectively.
