
Fig. 3.
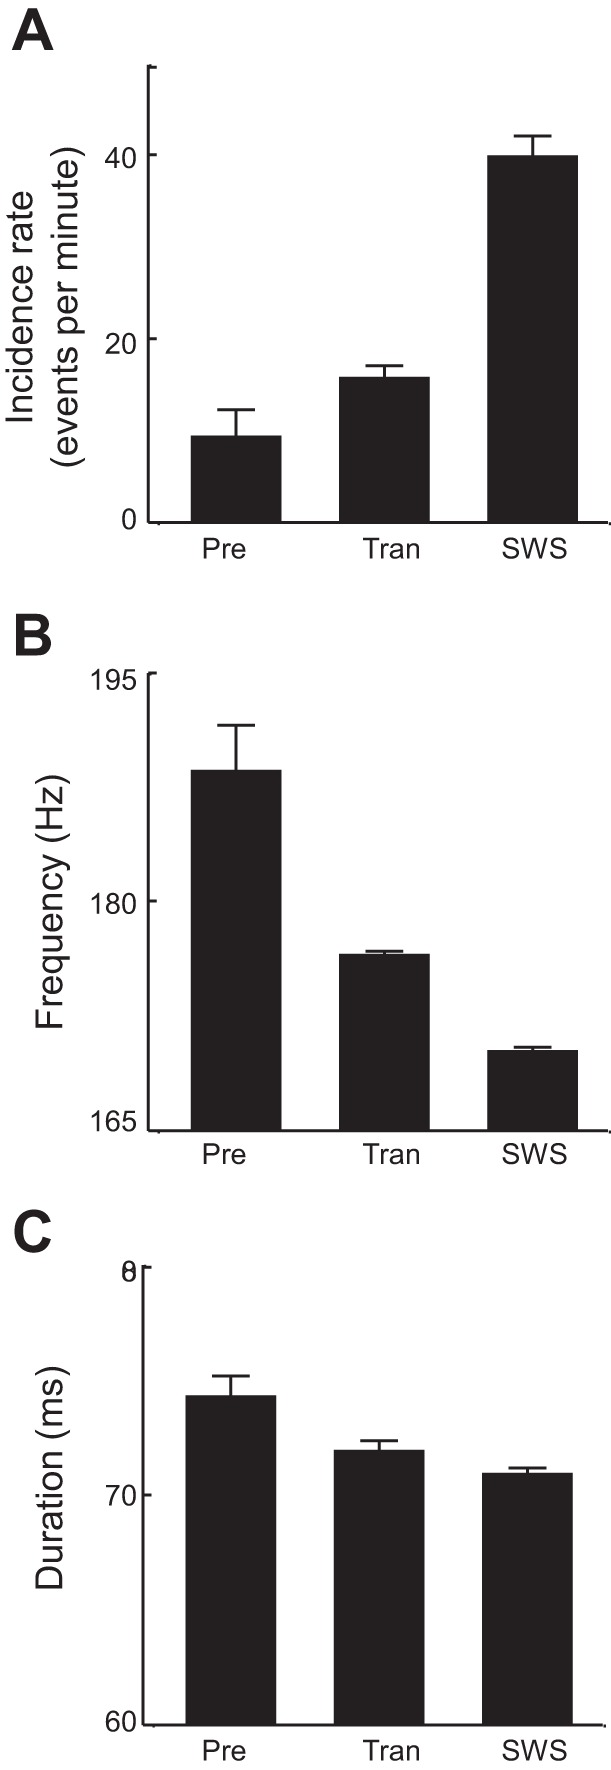
Quantification of hippocampal ripple events during different behavioral stages. Mean incidence rate (A), mean frequency (B), and mean duration (C) of ripple events are plotted for the 20-s period before the 1st detected HVS event (Pre), the entire transitional period (Tran), and SWS following the transitional period.