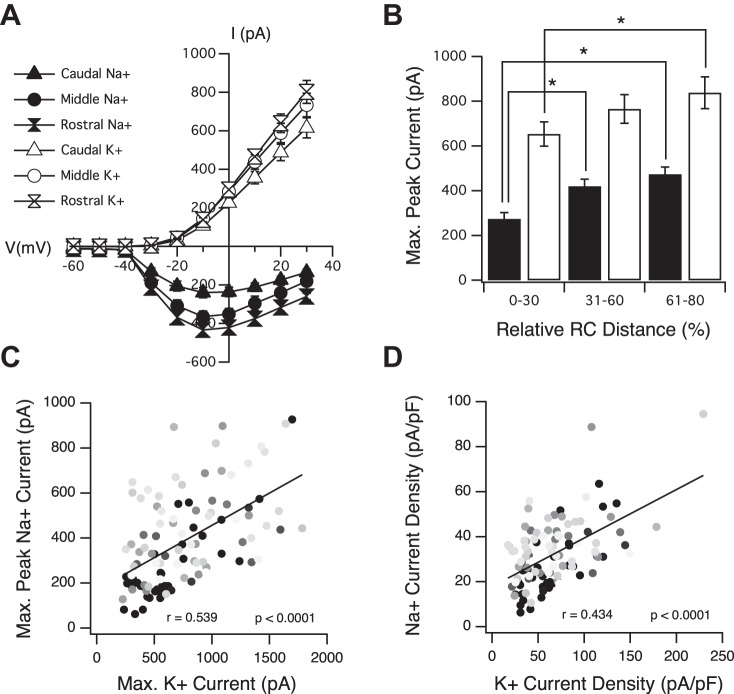
Fig. 2.
Peak Na+ and K+ currents increase along the RC axis of the optic tectum. A: averaged current-voltage (I-V) plots of tectal neurons from different segments of the RC axis. B: average maximum peak Na+ (black bars) and maximum persistent K+ (white bars) currents increase along the RC axis. *P < 0.05, t-test. C: maximum peak Na+ vs. maximum persistent K+ currents within individual neurons. Notice that the increase in these 2 currents is well correlated within individual neurons. Dark gray circles, most caudal (immature); light gray circles, most rostral (more mature). D: Na+ current density vs. K+ current density within individual neurons. A–D: n = 39 for caudal; n = 39 for middle; n = 34 for rostral.

