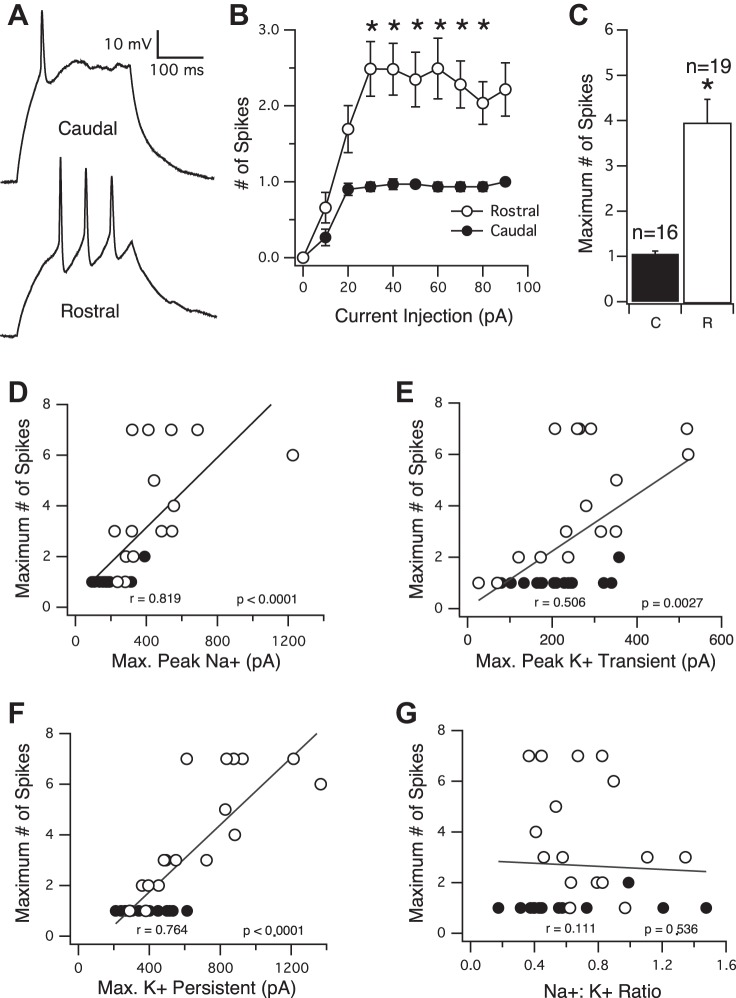
Fig. 3.
The number of spikes that a neuron can fire in response to a sustained injection of current also increases along the RC axis. A: sample current-clamp traces of action potentials recorded from a caudal (top) and rostral (bottom) neuron, evoked by injection of a square, 250 ms current pulse. B: averaged input-output curves showing the number of spikes evoked by injection of differing amounts of current (expressed in pA). Neurons from the rostral part of the tectum (white circles) fire significantly more action potentials than caudal neurons (black circles) at essentially every step of current injection. C: average maximum number of action potentials that a neuron fires in response to current injection. Rostral neurons fire significantly more action potentials than caudal neurons. *P < 0.0001. D–G: maximum number of spikes plotted as a function of peak Na+, transient K+, persistent K+ currents, and Na+:K+ ratio, respectively. Black circles, caudal; white circles, rostral.

