Fig. 2.
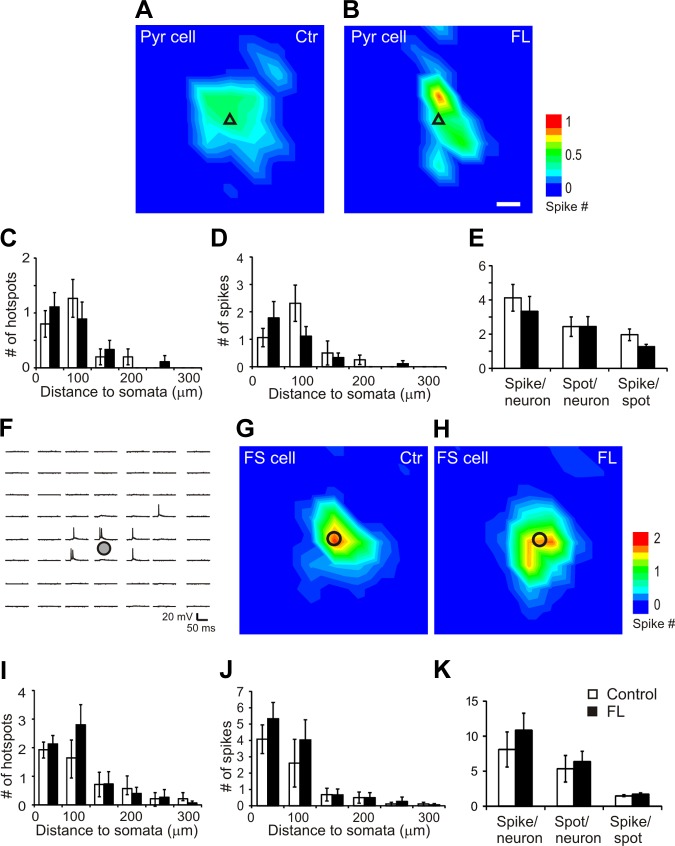
Glutamate uncaging on neuronal somata induced similar direct excitation profiles of cortical pyramidal neurons and FS neurons in the control and FL neocortex. A and B: average action potential (AP) maps in pyramidal (Pyr) neurons in the control (A; n = 16) and FL cortex (B: n = 9). Most of the APs were activated by stimuli close to the somata of recorded neurons. Black triangles in A and B indicate somata of recorded pyramidal neurons. Scale bar in B = 50 μm for A, B, G, and H. C–E: analysis of maps in A and B showed that there were no significant differences between the control and FL groups in mean number of hotspots (C) and evoked APs (D) per map at different distances to somata. There were also no significant differences in the mean numbers of AP spikes per neuron, hotspot per neuron, and spikes per hotspot between the control and FL groups (E). F: representative map of uncaging evoked AP firing in a cortical layer V FS neuron. An area of 300 × 350 μm was photostimulated by UV laser flashes with a 50-μm spacing. Note that AP firing was triggered only in an area close to the soma. Black circles in F–H indicate somata of recorded FS cells. G and H: average AP maps in FS neurons in the control (G; n = 14) and FL cortex (H; n = 15). Most of the APs were activated by stimuli close to the somata of recorded neurons. Black circles indicate somata of recorded FS neurons. I–K: there were no significant differences between the control and FL groups in mean number of hotspots (I) and evoked APs (J) per map at different distances to FS neuron somata. There were also no significant differences in the average numbers of AP spikes per FS neuron, hotspot per FS neuron, and spikes per hotspot between the control and FL groups (K).

