Fig. 3.
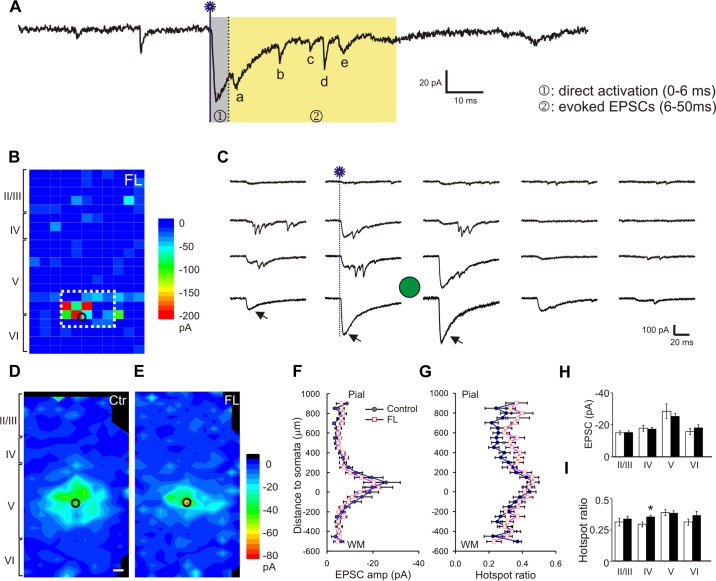
Enhancement of excitatory synaptic input onto layer V FS interneurons in the FL cortex. A: trace from a representative recording showing measurement of uncaging evoked events. Glutamate uncaging (blue line with a star; same in the following figures) caused direct activation of neuronal soma, which usually peaked within 6 ms (gray area). Evoked excitatory postsynaptic currents (EPSCs) were detected in a time window between 6 and 50 ms after laser flashes (events a–e in the yellow area) and were summed to generate a composite EPSC. B: representative uncaging map of a FS neuron in the FL cortex. The composite amplitude for each spot was color-coded and its location plotted relative to the slice. The distance between neighboring uncaging spots in B and C and Fig. 5, B and C, was 50 μm. C: 5 columns of traces show responses evoked by corresponding 5 columns of uncaging spots inside the white rectangle in B. The arrows indicate responses of direct activation. The black or green circles in B–E and Fig. 5, B–E, mark the location of FS neurons. D and E: average maps of the composite amplitude of EPSCs in layer V FS cells of the control (C; n = 25) and FL (D; n = 20) groups. The color scale bar indicates mean composite EPSC amplitude; black areas indicate no mean values available. The scale bars in Fig. 3D and Fig. 5D: 50 μm. F and G: mean hotspot EPSC amplitude (E) and mean hotspot ratio (F) at various vertical distances from somata in the control and FL groups. There was a significant increase in hotspot ratio in the FL group (P < 0.05, two-way ANOVA). y-Axis scale: 0 = position of somata in layer V; positive numbers: toward pial surface; negative toward white matter. H: mean hotspot amplitudes from different cortical layers to layer V FS cells were similar between the FL and control groups. I: mean hotspot ratio in layer IV area was higher in the FL group than the control (*P < 0.05), but there were no significant differences in other cortical layers.

