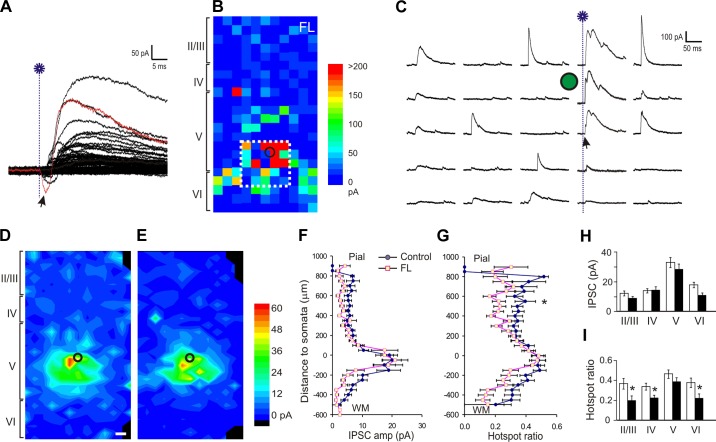
Fig. 5.
Reduction in inhibitory synaptic input onto layer V FS interneurons in the FL cortex. A: representative traces of uncaging evoked IPSCs in a map that were recorded at +20 mV. At this holding potential, uncaging-evoked directly activated AMPA receptor currents were small and inward (arrow) or invisible (arrow in C), and the IPSCs were outward, large, and readily differentiated from EPSCs. B: representative uncaging-evoked IPSC map of the FL cortex. For each uncaging spot, evoked IPSCs were detected in a time window between 0 and 50 ms after laser flashes and summed. The resulting composite amplitude for each spot was plotted and color coded as in Fig. 3. C: traces show the responses of uncaging spots inside the white rectangle in B. The onset of laser flash in the 4th column is marked with a blue dotted line. Note the large variability in the amplitude and waveform among different traces. D and E: average maps of the composite amplitude of IPSCs in layer V FS cells of the control (D; n = 26) and FL (E; n = 18) groups. Responses were evoked from more widespread cortical areas in control group. Black circles: cell location. F and G: mean hotspot IPSC amplitudes (E) and mean hotspot ratio (F) at various vertical distances from somata in the control and FL groups. There was no significant difference in hotspot amplitude (F), but there was a significant difference in hotspot ratio between the 2 groups (P > 0.05 in hotspot amplitude and P < 0.05 in hotspot ratio). A significant decrease in hotspot ratio was present between 500 and 550 μm superficial to the neuronal somata. The y-axis is labeled as in Fig. 3, E and F. H: there were no significant differences between the 2 groups in hotspot amplitudes of the evoked IPSCs. I: when the data were grouped according to cortical layers, hotspot ratios were significantly lower in layers II/III, IV, and VI of the FL group than the control group. *P < 0.05.

