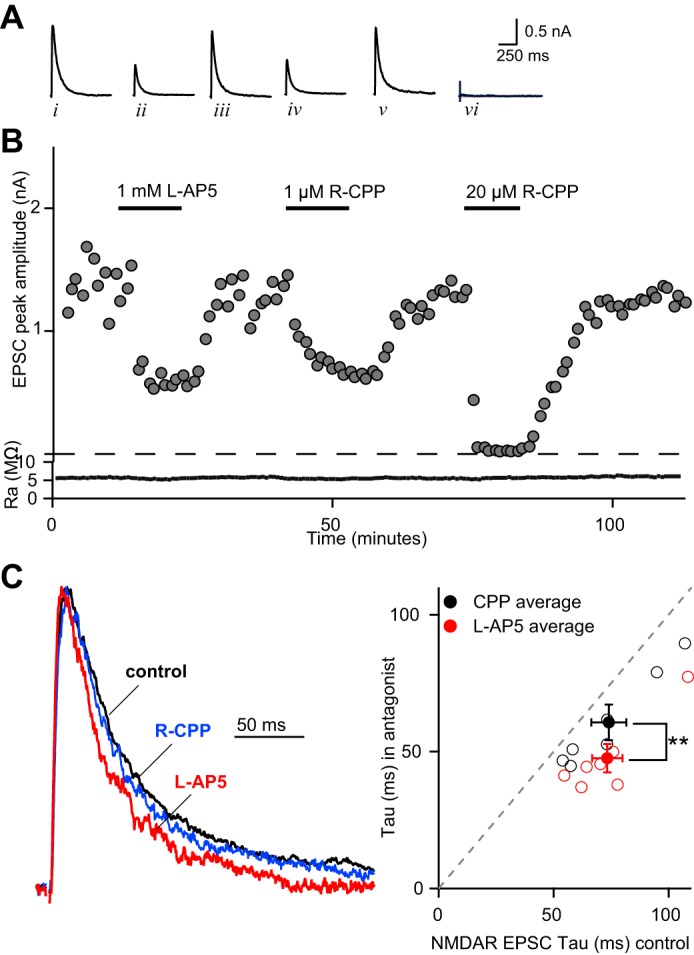
Fig. 3.

l-AP5 accelerates the NMDAR EPSC τ at the immature synapse. A: NMDAR EPSCs (Vh = +40 mV) recorded under control conditions (i, iii, and v) and in the presence of 1 mM l-AP5 (ii), 1 μM (R)-CPP (iv) or 20 μM (R)-CPP (vi). Traces are the average of 5 consecutive responses and correspond to the amplitudes plotted against time in minutes (B, top). Bottom: access resistance (Ra) is plotted. Recordings were performed in the presence of the AMPAR antagonist NBQX (5 μM). Bath temperature: 35 ± 1°C. C, left: representative normalized NMDAR EPSCs from before (black trace) and during application of l-AP5 (red trace) or low concentration of (R)-CPP (blue trace). C, right: scatterplot of NMDAR EPSC weighted τ before (X-axis) and in the presence of antagonist (Y-axis). Average values are represented by solid circles shown as means ± SE. CPP (black circle), control τ: 74.0 ± 7.7 ms, CPP τ: 60.7 ± 6.5 ms; l-AP5 (red circle), control τ: 73.3 ± 6.6 ms; l-AP5 τ: 47.6 ± 5.2 ms. Individual experiments are shown as open circles. **P = 0.01.
