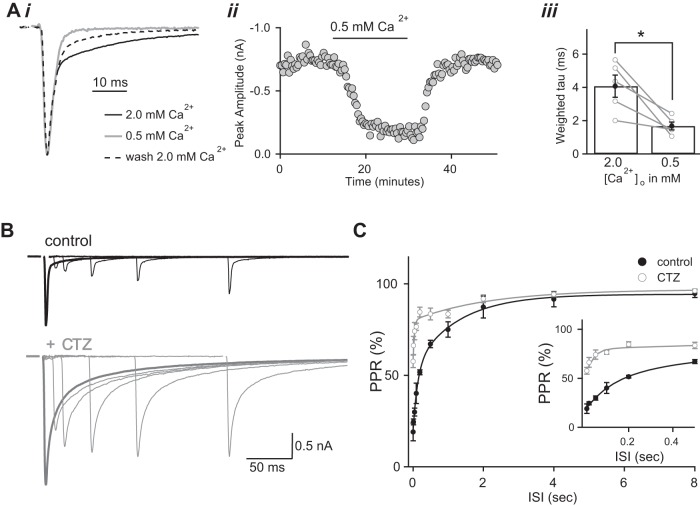
Fig. 4.
Experimental evidence in support of glutamate spillover. Ai: overlaid AMPAR EPSC traces normalized to peak amplitude in 2.0 mM (black and dashed traces) and 0.5 mM (gray) external Ca2+, recorded at Vh = −70 mV in R-CPP (20 μM) and d-AP5 (50 μM) to block NMDAR-mediated EPSCs. To facilitate comparison of decay, normalized EPSCs are aligned by peak amplitude. ii: Peak amplitude of AMPAR ESPSCs plotted over the time course of an experiment. iii: Bar graph of AMPAR weighted τ in 2.0 and 0.5 mM external Ca2+ (n = 5, P < 0.05); individual experiments are shown in gray. CTZ was not included in the bath solution. [Ca2+]o, extracellular Ca2+ concentration. *P < 0.05. B: superimposed AMPAR EPSC2 traces evoked at different interstimulus intervals (ISIs) before (black) and during (gray) bath application of 50 μM CTZ. Traces are the average of 3–5 trials. The EPSC2 waveforms were calculated by subtracting the average single EPSC from the average EPSC response to a pair of stimuli. The single EPSC (EPSC1) waveform is shown in bold. C: the average paired pulse ratio (PPR) calculated as %EPSC2/EPSC1 is plotted against ISIs for control (black; n = 5 cells) and CTZ (gray; n = 5 cells). Error bars indicate SE (P << 0.001, 2-way ANOVA). Inset: initial phase of the recovery from depression is shown on an expanded time scale. Recordings were made in the presence of (R)-CPP (20 μM) to block NMDAR-mediated EPSCs. Bath temperature: 35 ± 1°C.

