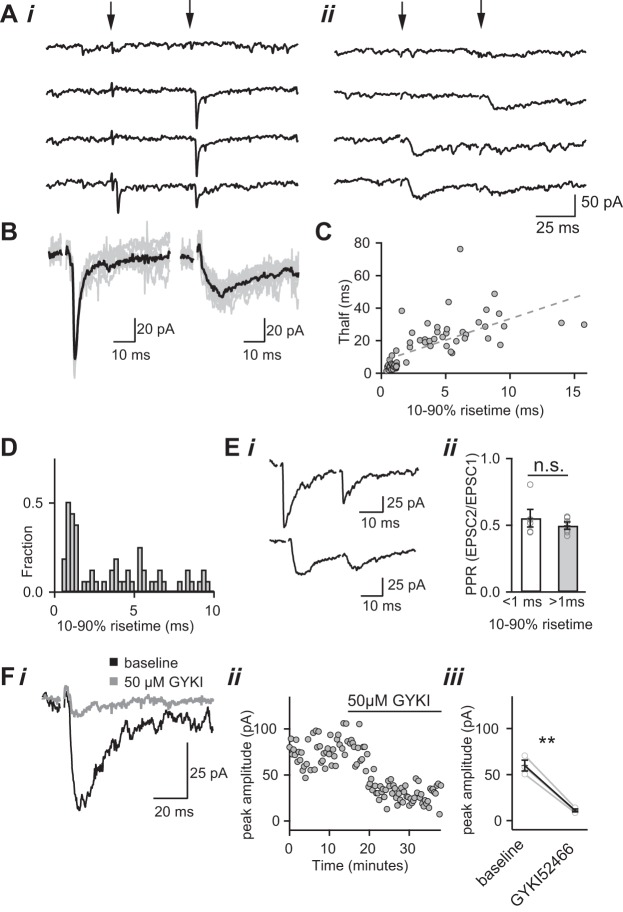
Fig. 5.
Identification of slow- and fast-rising single-fiber AMPAR EPSCs. Ai: example of a fast-rising single-fiber current. Pairs of stimuli separated by 50 ms (arrows indicate the time of stimulus) are increased from subthreshold until a response emerges from noise (Vh = −70 mV). A response on the second, but not first, pulse indicates the single-fiber response is near threshold. ii: The same technique is used to identify slow-rising single-fiber currents. B: comparison of two types of single-fiber AMPAR EPSC responses recorded from the same thalamic relay neuron. The stimulus electrode position in the optic tract differed for the two types of synaptic currents. Overlay of fast- (left) and slow-rising (right) single-fiber currents evoked from 7–10 consecutive trials is shown. The average waveform is shown in black. Currents were recorded at Vh = −70 mV in the presence of NMDAR antagonists and CTZ. C: scatterplot of half decay time (Thalf) vs. rise time for all single fibers (n = 63); dotted line represents linear regression fit (Pearson correlation coefficient r2 = 0.47; P << 0.0001). D: histogram of the 10–90% rise times of all of the observed single-fiber AMPAR EPSCs. Ei: representative averaged traces showing paired-pulse depression occurs with both fast-rising (top) and slow-rising EPSCs (bottom). ii: Summary graph of average PPR of fast rise (<1 ms, n = 5) and slow rise (>1 ms, n = 5) EPSCs. F: average traces (i) and time course of the peak amplitude (ii) of slow-rising EPSC before and during bath application of an AMPAR-specific antagonist 50 μM GYKI52466. iii: Summary plot of the effects of GYKI52466 on the peak amplitude of slow-rising EPSCs (n = 3). **P < 0.01. Bath temperature: 35 ± 1°C. ns, Nonsignificant.

