Fig. 9.

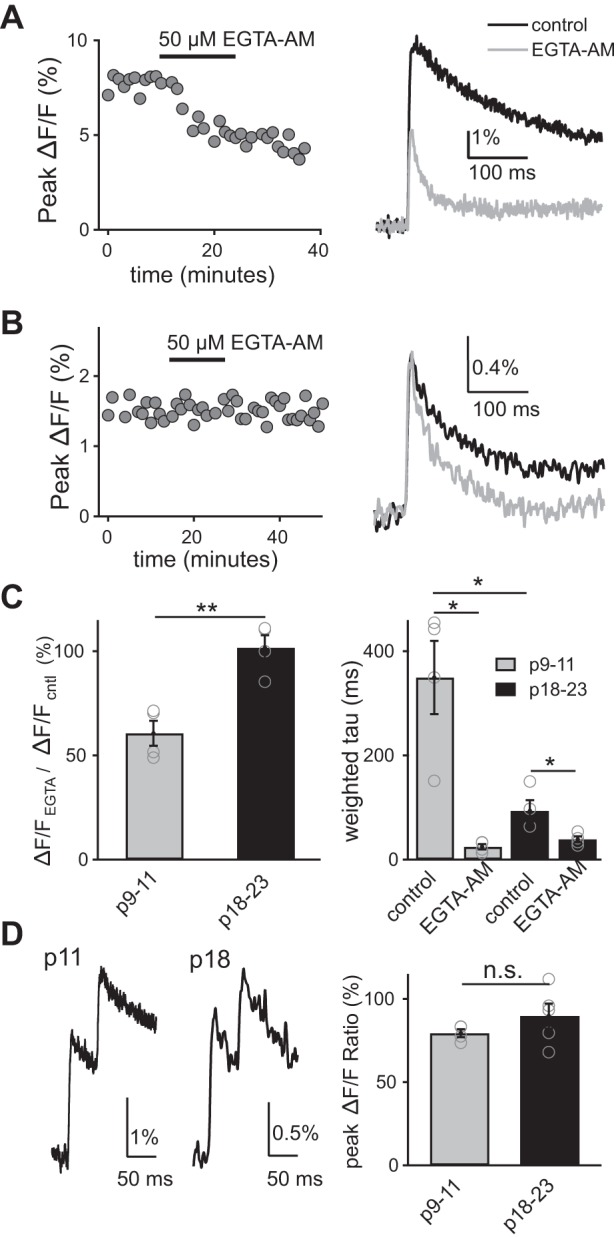
The presynaptic calcium transient at the immature synapse is more sensitive to EGTA-AM than that of the mature. A and B, left: representative time course is shown of peak relative change in fluorescence (ΔF/F) signal before, during and 15 min following application of 50 μM EGTA-AM from p9–11 (A) and p18–23 (B) synapses. A and B, right: representative ΔF/F signals evoked by optic tract stimulation before (black) and 15 min after (gray) EGTA-AM application in immature (A) and p18–23 (B) mice. Traces are the average of 3–5 trials. C: summary of the average change in the peak amplitude (left) and weighted τ (right) of the ΔF/F in the presence of EGTA-AM relative to baseline in p9–11 (gray) and p18–23 (black). *P < 0.05. **P < 0.01. D: averaged representative traces of ΔF/F signal in response to a pair of optic tract stimuli (ISI = 50 ms) shown for immature (left) and p18–23 (middle) synapses. D, right: summary of peak ΔF/F ratio from immature and p18–23 (n = 4 and 5, respectively, P > 0.2).
