FIG. 8.
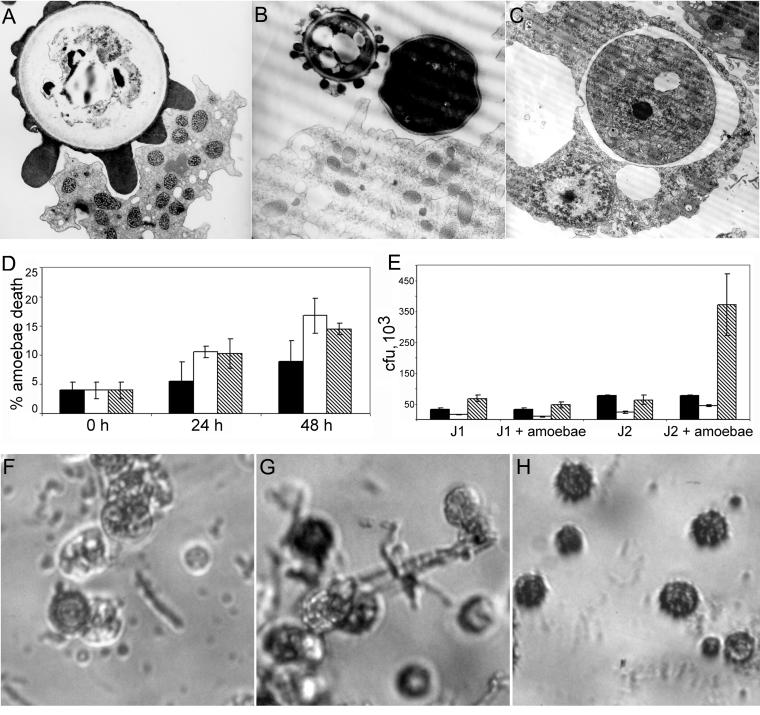
Interactions of H. capsulatum conidia with amoebae. (A) TEM illustrating A. castellanii phagocytosing a conidial cell after 2 h of incubation. (B) Micrograph depicting a conidial cell and a yeast cell in proximity to an amoeba cell after 24 h of incubation. (C) Micrograph illustrating an internalized H. capsulatum yeast cell surrounded by a membrane-bound vacuole after 24 h of incubation. (D) Trypan blue exclusion assay results illustrating the percentage of dead amoebae after incubation with and without H. capsulatum conidia at 0, 24, and 28 h. Solid bars indicate amoebae in PBS only, open bars represent amoebae with J1 conidia, and hatched bars represent J2 conidia with amoebae. Error bars each represent one standard deviation. At 24 h, the P value was 0.028 when comparing amoebae alone to both J1 and J2 conidia with amoebae, and at 48 h, death of amoebae incubated with J1 and J2 was also significant compared to amoebae alone (P = 0.015 and 0.022, respectively). (E) Changes in CFU of J1 and J2 conidia after incubation with amoebae. Solid bars represent CFU at 0 h, open bars represent CFU at 24 h, and hatched bars represent CFU at 48 h. Error bars each denote one standard deviation. Both the 24- and 48-h results for J2 conidia with amoebae are significant compared to J2 in PBS alone (P ≤ 0.001 for both). (F and G) Micrograph depicting morphology changes of J2 conidia after 24 h of incubation with amoebae illustrating conidial, yeast, and hyphal forms of H. capsulatum J2. (H) Micrograph of J2 conidia after 24 h of incubation in PBS. Magnification, ×15,000 (A), ×12,000 (B and C), and ×200 (F, G, and H).

