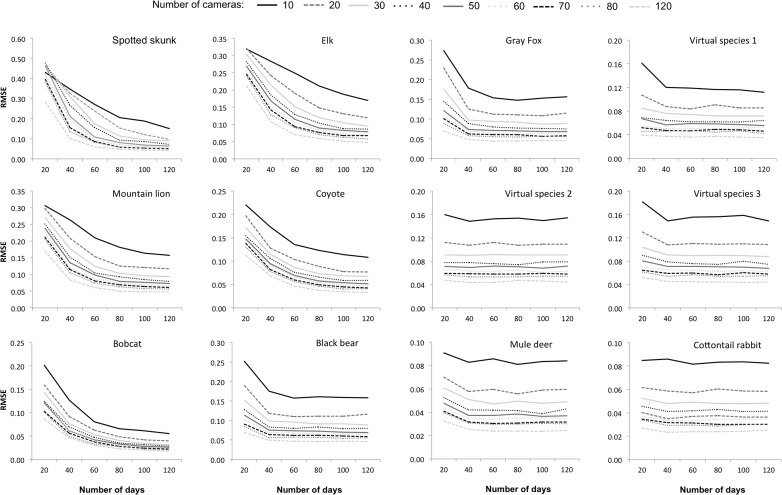
Figure 4. Simulation results for each study species.
The influence of survey effort on the error associated with the occupancy estimate (RMSE, root mean squared error), as a function of number of sites (10–120 cameras), occasions (20–120 survey days), and species. Species are presented in order of increasing detection probability (from the top left), with the scale of the y-axis varying between taxa. Raccoons are absent as a reliable estimate could not be achieved due to the lack of data.

