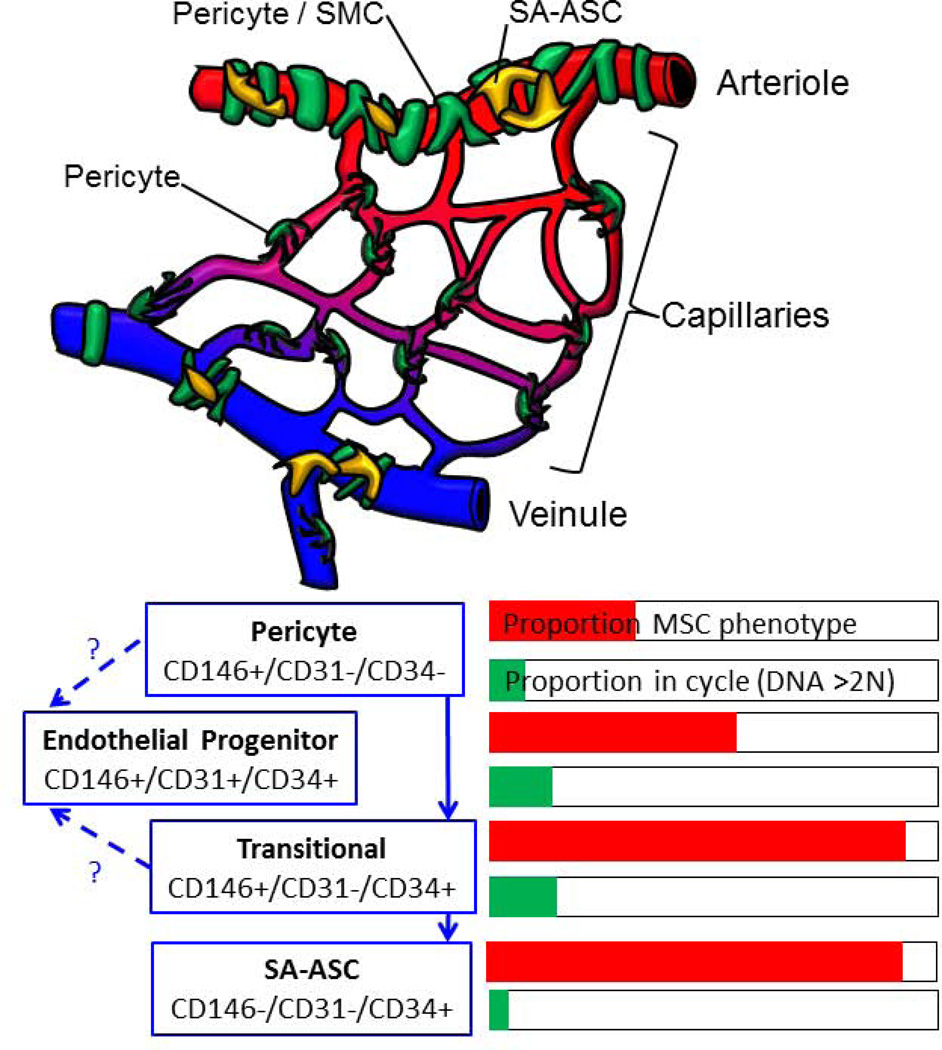
Figure 3.
Schematic representation of the organization of adipose SVC and a working model of SVF differentiation. The upper figure is a schematic representation drawn from previously published work. Cells associated with the small vessels of adipose tissue are coded as follows: Endothelial cells (red), pericytes and smooth muscle cells (green), and supra-adventitial adipose stromal cells (yellow). The lower diagram is a working model based on the present results. For each cell type defined by phenotype, the bar graphs show the proportion of cells with a mesenchymal phenotype (CD73+/CD105+ as shown in Figure 2) and the proportion of proliferating cells.

