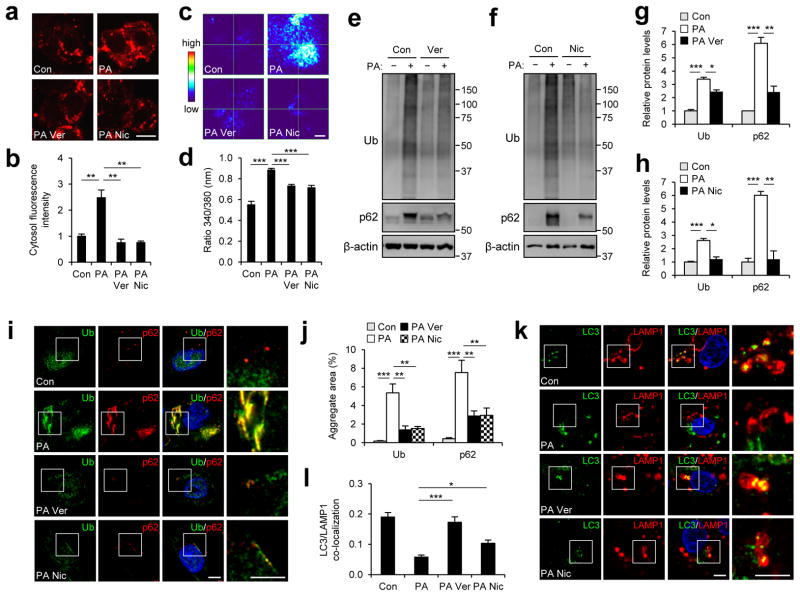
Figure 2. Calcium channel blockers suppress saturated fatty acid-induced protein inclusion formation.
HepG2 cells were treated with BSA (Con or (−)), PA (500 μM), PA + verapamil (Ver, 50 μM) or PA + nicardipine (Nic, 100 μM) for 9 hr. (a–d) After each treatment, cells were loaded with a calcium indicator X-Rhod-1-AM (a, b) or Fura-2-AM (c, d). Calcium levels were visualized by laser confocal microscopy (a) or by dual fluorescent microscopy (c, 340/380 nm ratio image) and quantified (b, d; n = 8 and 30, respectively). (e–h) Cells with indicated treatments were subjected to solubility fractionation. 1% Triton X-100-insoluble fractions were dissolved in 2% SDS, analyzed by immunoblotting (e, f) and quantified (g, h) (n = 3). (i–l) Cells with indicated treatments were subjected to immunostaining with indicated antibodies (i, k). DNA was stained with DAPI (blue). Amount of aggregated proteins was quantified (j) (n = 10). Co-localization between LAMP1 and LC3 was quantified (l) (n = 4). Boxed areas in fluorescence images are magnified in right-most panels (i, k). Scale bars, 10 μm (a), 20 μm (c), 5 μm (i, k). All data are shown as mean ± s.e.m. *P < 0.05, **P < 0.01, ***P < 0.001 (Student’s t test). Molecular weight markers are indicated in kDa.

