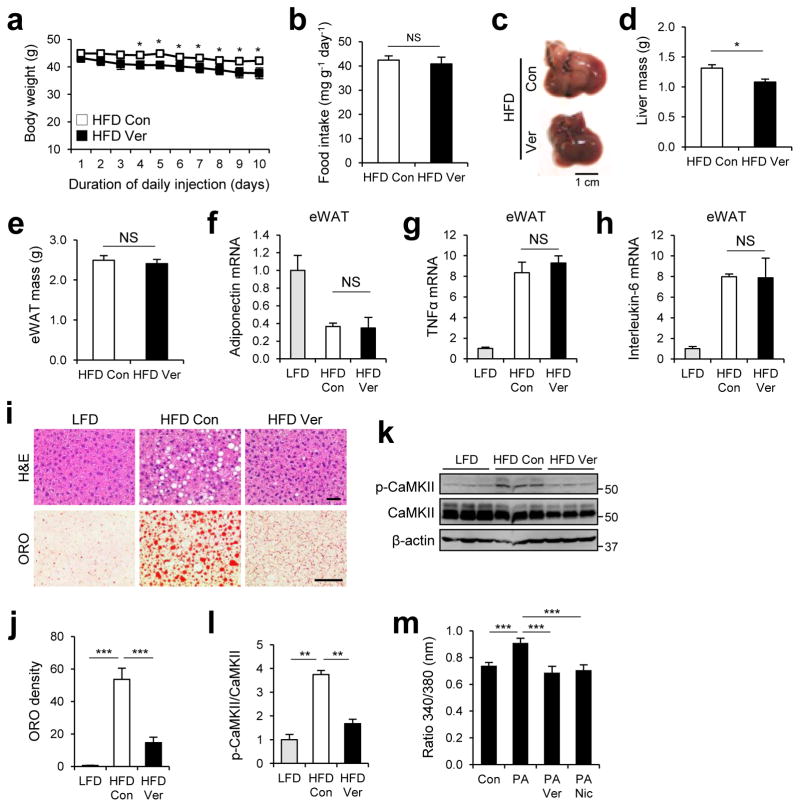
Figure 3. Verapamil relieves hepatosteatosis of obese mice.
4 month-old C57BL/6 male mice kept on HFD for two months were subjected to daily administration of PBS (Con, n = 4) or verapamil (Ver, 25 mg kg−1 body weight, i.p., n = 3) for 10 days. LFD-kept mice (n = 5) of same age were used as a negative control. (a) Body weight was daily monitored during injection period. (b) Daily food consumption was measured during injection period. (c) Livers were harvested from indicated mice and photographed. (d, e) Total liver mass (d) and total epididymal white adipose tissue (eWAT) mass (e) were measured from indicated mice. (f–h) Relative mRNA expression was analyzed from eWAT of indicated mice through quantitative RT-PCR. (i, j) Liver sections were analyzed by hematoxylin and eosin (H&E, upper panels) and Oil Red O (ORO, lower panels) staining (i). ORO densities were quantified (j). (k, l) Calcium-induced CaMKII autophosphorylation in livers was analyzed by immunoblotting (k) and quantified (l). (m) Primary hepatocytes from 2 month-old C57BL/6 mice kept on LFD were treated with BSA (Con), PA (500 μM), PA + verapamil (Ver, 50 μM) or PA + nicardipine (Nic, 100 μM) for 12 hr. After each treatment, cells were loaded with a calcium indicator Fura-2-AM. Calcium levels were visualized by dual fluorescent microscopy at 340/380 nm, and ratio of fluorescence intensities of Fura-2-AM at 340 nm over 380 nm was quantified (n = 17). Scale bars, 1 cm (c), 200 μm (i). All data are shown as mean ± s.e.m. *P < 0.05, **P < 0.01, ***P < 0.001 (Student’s t test). Molecular weight markers are indicated in kDa.

