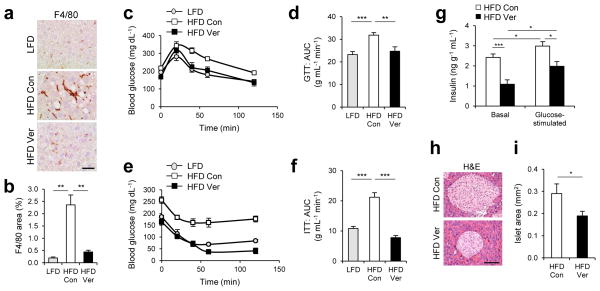
Figure 6. Verapamil reduces liver inflammation and improves metabolic homeostasis.
4 month-old C57BL/6 male mice kept on HFD for two months were subjected to daily administration of PBS (Con, n = 4) or verapamil (Ver, 25 mg kg−1 body weight, i.p., n = 3) for 10 days. LFD-kept mice of same age (n = 5) were used as a negative control. (a, b) Liver sections were subjected to F4/80 immunostaining, which visualizes macrophage infiltration and hematoxylin counterstaining (a). F4/80-positive areas were quantified (b). (c–f) Glucose tolerance tests (GTT, c, d) and insulin tolerance tests (ITT, e, f) were conducted using indicated mice (c, e). Area-under-the-curve (AUC) was quantified from GTT and ITT data (d, f). (g) Serum insulin levels were measured from indicated mice before (Basal) and 10 min after (Glucose-stimulated) glucose injection (n = 4). (h, i) Pancreas sections were analyzed by hematoxylin and eosin (H&E) staining (h). Islet areas were quantified (i) (n = 4). Scale bar, 200 μm (a), 100 μm (h). All data are shown as mean ± s.e.m. *P < 0.05, **P < 0.01, ***P < 0.001 (Student’s t test).

