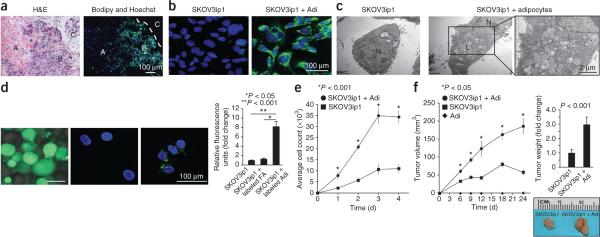
Figure 2.
Ovarian cancer cells use adipocyte-derived lipids for tumor growth. (a) Lipid (green) accumulation in human omental metastatic ovarian cancer. The interface between ovarian cancer cells and adipocytes is indicated by a dashed line (H&E staining). Ovarian cancer cells (A) that do not interact with adipocytes (C) lack intracellular lipid staining. The ovarian cancer cells in contact with adipocytes (B) contain more intracellular lipids (nuclear counterstaining, blue). (b,c) Lipid (green) accumulation in SKOV3ip1 cells cultured alone or with primary human omental adipocytes (repeated with two additional human subject samples), as determined using confocal microscopy (b), or fixed and examined with transmission electron microscopy (c) (N, nucleus; L, lipid droplets). (d) Fluorsescently labeled fatty acids (FAs) were incubated with and taken up by adipocytes (left) or SKOV3ip1 cells (middle). The labeled adipocytes were cocultured with SKOV3ip1 cells, the adipocytes were removed, and the labeled FAs that were transferred from adipocytes to SKOV3ip1 cells were detected by confocal microscopy (right). Fluorescence quantification is in the right graph. Bars report means ± s.e.m. from one of three experiments, conducted with different human subject samples. (e) In vitro proliferation of SKOV3ip1 cells alone or cocultured with adipocytes over 4 d. Graph reports means ± s.e.m. from one of three experiments, completed using different human subject samples. (f) In vivo growth of subcutaneous tumors after injection of SKOV3ip1 cells with or without adipocytes in each flank of the same mouse. Graphs depict tumor volume measured over 24 d (left) and final tumor weight (right). Representative tumor images from one mouse are included (three or four mice per group). Graphs report means ± s.e.m. from one of three experiments, conducted using omental adipocytes from different human subject samples.

