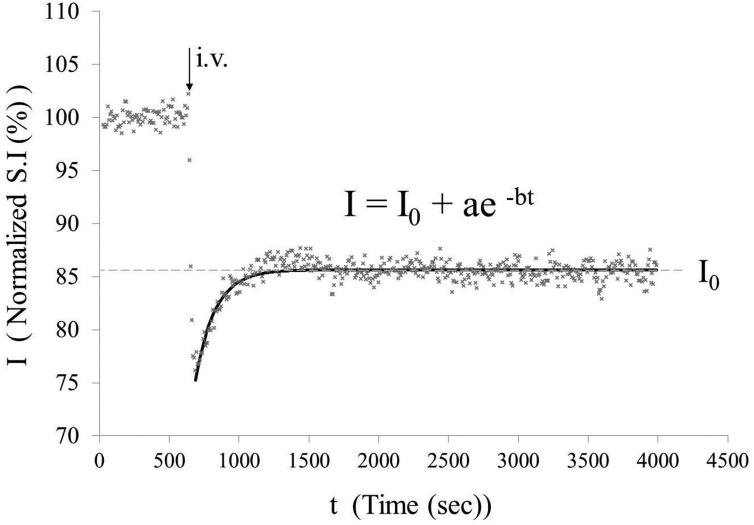
Figure 6.
Intensities at the steady state of each area, expressed as percentage against the averaged intensity of identical pixel prior to administration of H2O17, were determined by fitting their time course by the function: I = I0+ae(-bt). I0 denotes the normalized signal intensity at infinite time (t = ∞) calculated from the fitted curve (13).

