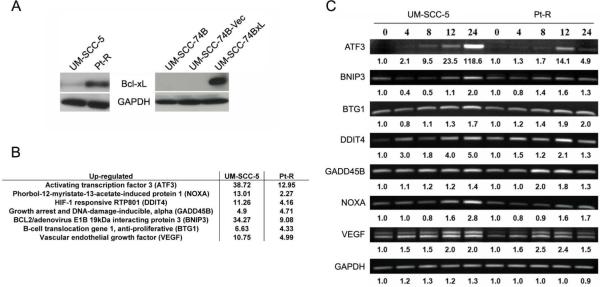
Figure 2.
A. Bcl-xL and GAPDH expression in cell lines discussed. UM-SCC-74B-Vec represents a vector-only control. B. Fold increase in mRNA levels following 10 μM (−)-gossypol treatment for 24 hours for selected ROS family genes found by cDNA microarray analysis in UM-SCC-5 and Pt-R. Fold increase is shown versus paired untreated control (described in materials and methods). C. RT-PCR/gel electrophoresis validation of increases in gene expression following (−)-gossypol treatment seen in microarray analysis. Values underneath represent densitometry values of fold increase versus the respective cell line untreated control.

