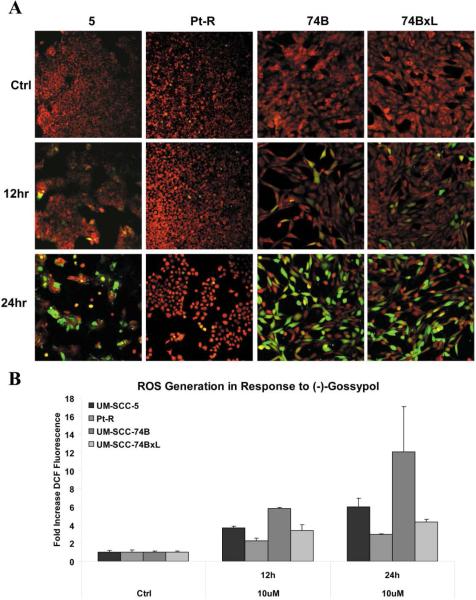
Figure 3.
A. Representative images from confocal microscopy of indicated cell lines following treatment with 10 μM (−)-gossypol for 0, 12, or 24 hrs. MitoTracker (red) indicates functioning mitochondria, and increased fluorescence of CM-H2DCFDA (green) denotes generation of intracellular ROS. B. Quantification of increased intracellular ROS generation demonstrated in (A) by flow cytometry, as fold increase in DCF fluorescence versus untreated control. All increases in fluorescence versus control were statistically significant (p < .05). Increases in fluorescence between each high Bcl-xL and low Bcl-xL cell line were also statistically significant. For UM-SCC-5 vs. Pt-R, p = .0026 and p = .0045, at 12 and 24 hrs, respectively. For UM-SCC-74B vs. -74BxL, p < .0001 and p = .032 at 12 and 24 hrs, respectively.

